Curve Best Yields & Key Metrics | Week 39, 2025
Weekly yield and Curve ecosystem metric updates as of the 25th September, 2025

Market Overview
Crypto markets are down across the board this week; here are the key updates for Curve:
- TVL decreased 6.3% to $2.476B, outperforming the average 8.2% decline across the DeFi sector.
- scrvUSD made its debut among the top yields this week, offering 12.6%.
- Using a credit line from Curve, YieldBasis successfully launched and has reached its initial $1M deposit limit for its three markets (WBTC, tBTC, and cbBTC).
- Curve is now live on Plasma.
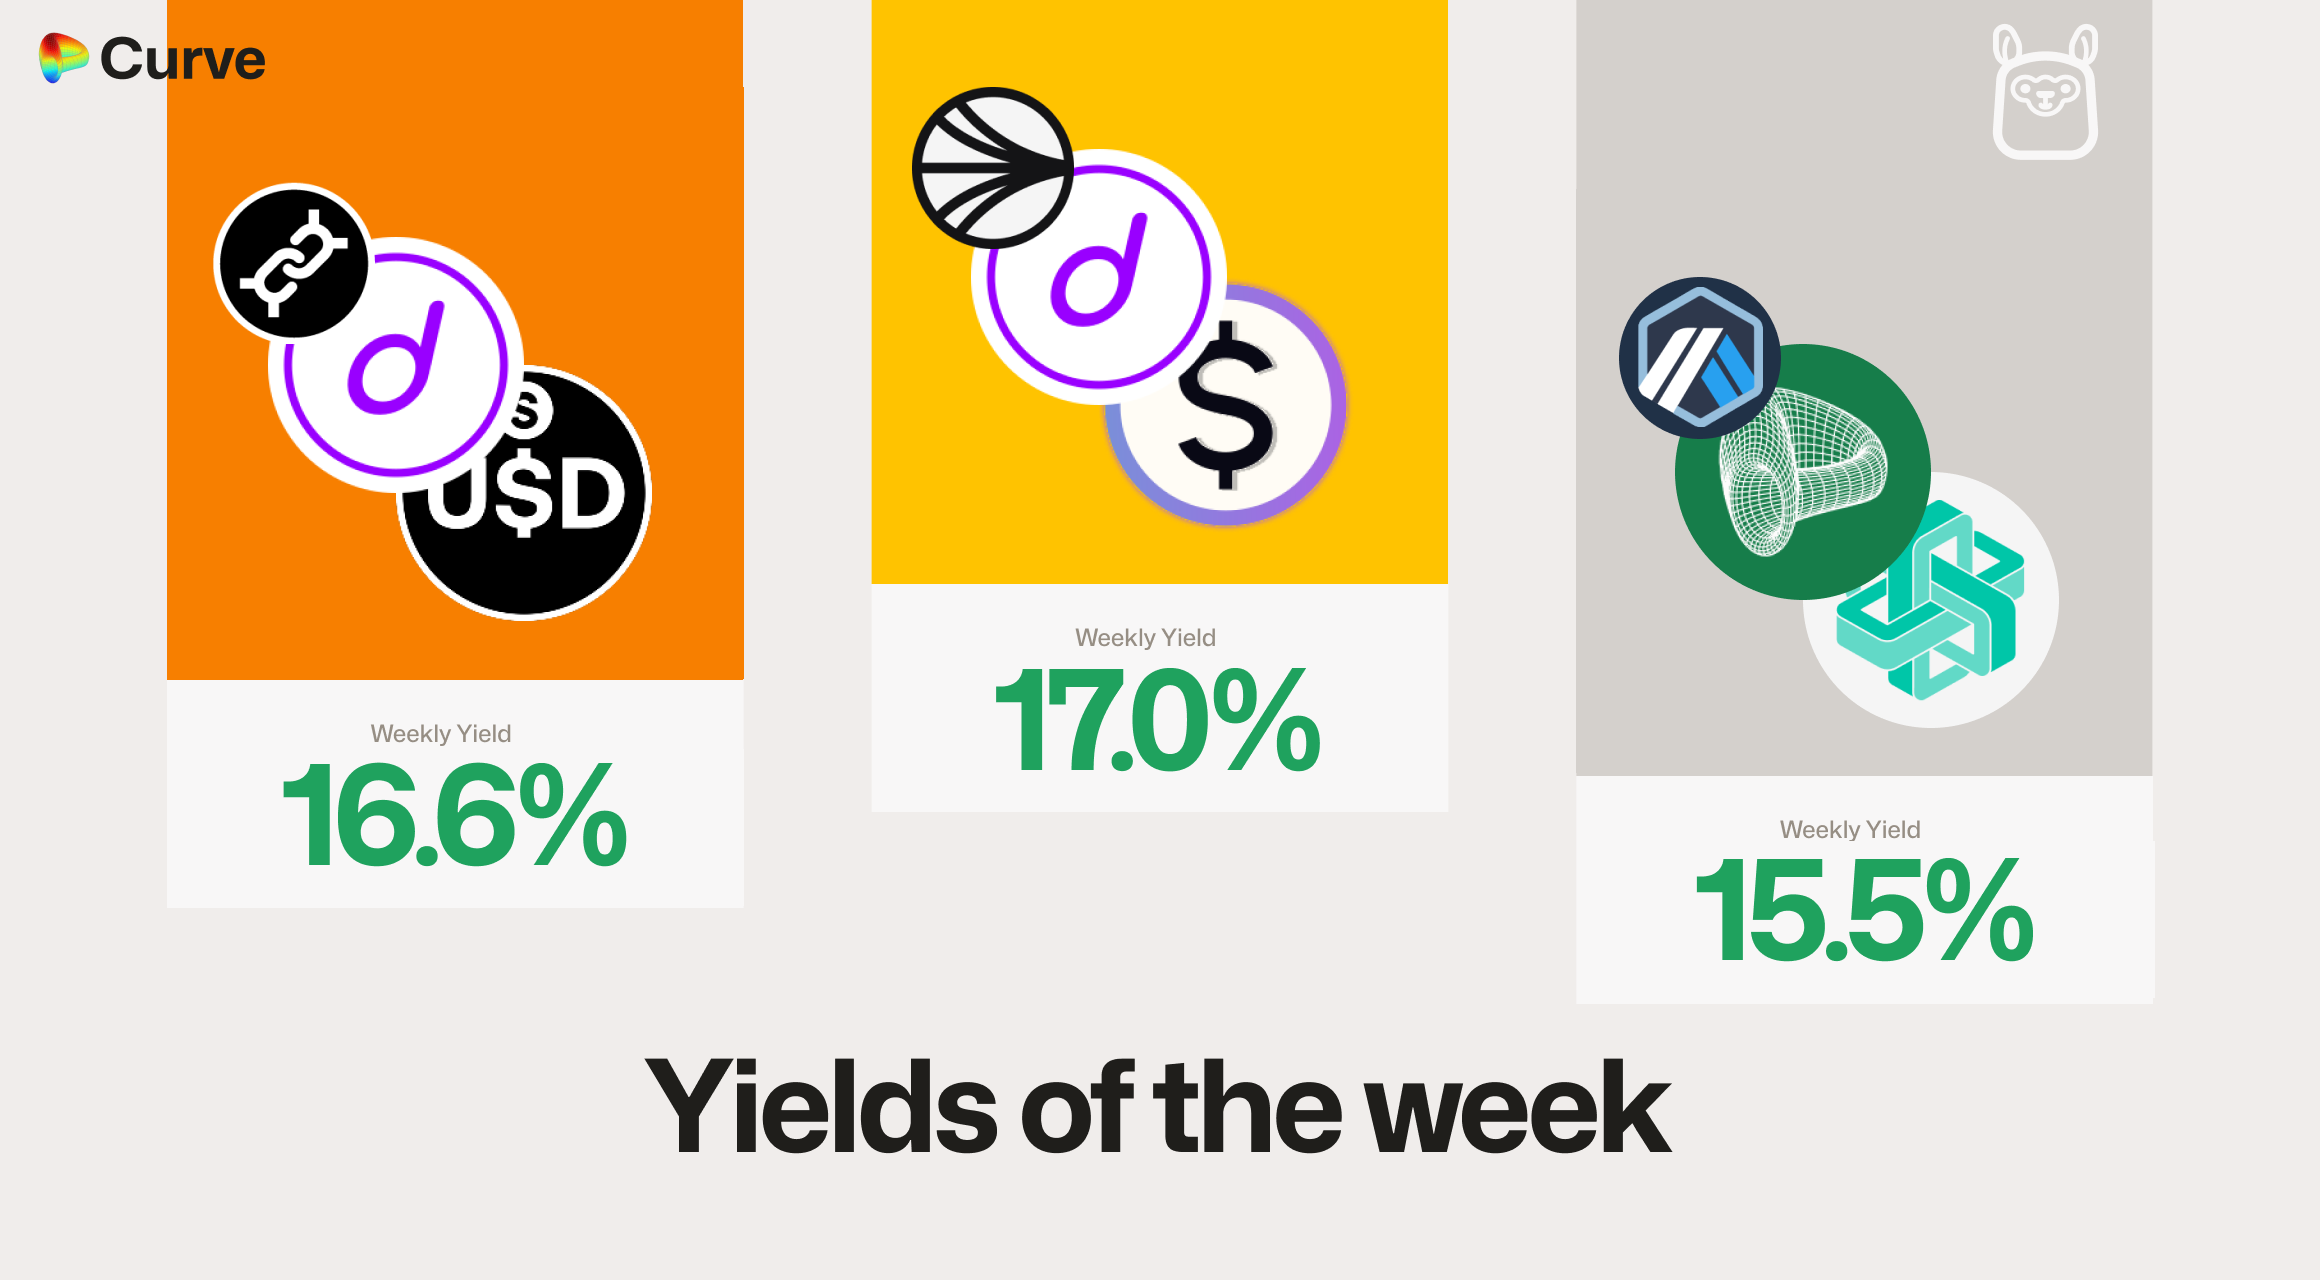
Top Yields
USD Stablecoins
| Chain | Market | Type | Yield |
|---|---|---|---|
 |
 sdUSD sdUSD wstkscUSD wstkscUSD |
Pool | 17.0% |
 |
 sdUSD sdUSD sfrxUSD sfrxUSD |
Pool | 16.6% |
 |
 crvUSD crvUSD EYWA EYWA |
Llamalend | 15.5% |
|
 crvUSDsfrxUSD crvUSDsfrxUSD |
Llamalend | 15.0% |
|
 alUSD alUSD USDC USDC |
Pool | 13.4% |
 |
 miMATIC miMATIC USDC.e USDC.e |
Pool | 13.3% |
 |
 crvUSD crvUSD WETH WETH |
Llamalend | 12.6% |
 |
 scrvUSD scrvUSD |
scrvUSD | 12.6% |
|
USDC DAI DAI |
Pool | 12.5% |
|
DAI USD₮0 USD₮0 |
Pool | 12.5% |
Top BTC & ETH Yields
| Chain | Market | Asset | Yield |
|---|---|---|---|
|
 ynETHx ynETHx WETH WETH |
ETH | 5.5% |
|
 msETHWETH msETHWETH |
ETH | 4.9% |
|
 frxETH frxETH sfrxETH sfrxETH |
ETH | 4.3% |
|
 uniBTC uniBTC brBTC brBTC |
BTC | 3.1% |
|
 WBTCuniBTC WBTCuniBTC |
BTC | 1.6% |
|
 WBTC WBTC tBTC tBTC |
BTC | 1.3% |
Other Top Yields
| Chain | Market | Asset | Yield |
|---|---|---|---|
|
 CrossCurve CRV/USD CrossCurve CRV/USD |
CRV | 26.9% |
|
CrossCurve CRV2 |
CRV | 18.5% |
|
 GHO GHO cbBTCWETH cbBTCWETH |
TRICRYPTO | 5.9% |
 |
 crvUSD crvUSD tBTC tBTC WETH WETH |
TRICRYPTO | 5.4% |
|
 EURA EURA EURT EURT EURS EURS |
EUR | 4.5% |
|
EURA EURC EURC |
EUR | 2.0% |
Weekly Metrics
crvUSD & scrvUSD
Borrow rates remain high, however, the crvUSD peg has now recovered to exactly $1. Consequently, rates should begin to decline, and peg stability reserves will slowly be deployed.
| Metric | Value | Change |
|---|---|---|
 crvUSD Minted crvUSD Minted |
$113M | -2.1% |
| Peg Stability Reserves |
$713k | -$244k |
 scrvUSD Yield scrvUSD Yield |
12.6% | +6.1% |
| crvUSD inscrvUSD |
44.5% | -3.1% |
| crvUSD Price |
$1.0000 | +$0.0002 |
| Avg. Borrow Rate |
12.1% | +0.3% |
Llamalend
Llamalend TVL is down, but this seems to be mostly due to collateral values decreasing, as loans and borrowed amounts seem to be sticky in comparison.
| Metric | Value | Change |
|---|---|---|
| 🦙 Llamalend TVL | $350M | -8.4% |
| 🦙 Supplied | $111M | +1.6% |
| 🦙 Borrowed | $199M | -0.8% |
| 🦙 Collateral | $326M | -9.1% |
| 🦙 Loans | 1568 | -1 |
DEX
TVL is down, however swaps and volumes increased. Interestingly, the total swapping fees remained the almost exactly the same at $328k, up only $107 this week compared to last week.
| Metric | Value | Change |
|---|---|---|
| 🔄 TVL | $2.29B | -5.5% |
| 🔄 Volume | $1.72B | +6.1% |
| 🔄 Swaps | 394k | +3.6% |
| 🔄 Total Fees | $328k | - |
DAO
veCRV holders saw a substantial increase in generated fees this week, up over 29% from last week to $243k. While a decline in the CRV token price affected emission values, other key metrics remained steady.
| Metric | Value | Change |
|---|---|---|
 CRV Circ. Supply CRV Circ. Supply |
1.41B | +0.2% |
| CRV Locked |
866M | - |
 Total veCRV Total veCRV |
785M | -0.4% |
| veCRV Distribution |
$243k | +29.3% |
| CRV Emissions |
$1.66M (2.22M CRV) | -5.0% |
| Inflation Rate |
5.011% | -0.005% |
DEX Winners & Losers
ETH pools in general were the big losers this week. With the decline in ETH price came a decline in liquidity demand, especially between stETH and ETH. The 3pool (DAI/USDC/USDT pool) had a great week however, as did sUSDe pools.
Fees Winners & Losers
| 📍 | Chain | Pool | Volume | Fees | Change |
|---|---|---|---|---|---|
| 1 | |
 sDAI sDAI sUSDe sUSDe |
$40.5M | $8.11k | +$5.56k |
| 2 | |
 DAI DAI USDC USDC USDT USDT |
$157M | $23.5k | +$5.28k |
| 3 | |
sUSDe sUSDS sUSDS |
$38.4M | $7.68k | +$5.17k |
| ... | ... | ... | ... | ... | ... |
| -3 | |
 reUSD reUSD scrvUSD scrvUSD |
$26.4M | $5.28k | -$4.59k |
| -2 | |
USDTWBTCWETH |
$5.48M | $11.1k | -$9.12k |
| -1 | |
 ETH ETH stETH stETH |
$99.9M | $9.99k | -$12.5k |
Volume Winners & Losers
sUSDS and PYUSD saw great volumes this week, while reUSD and stETH pools struggled compared to last week's figures.
| 📍 | Chain | Pool | Volume | Fees | Change |
|---|---|---|---|---|---|
| 1 | |
sUSDSUSDT |
$149M | $1.49k | +$70.5M |
| 2 | |
DAIUSDCUSDT |
$157M | $23.5k | +$35.2M |
| 3 | |
 PYUSDUSDC PYUSDUSDC |
$166M | $16.6k | +$34.5M |
| ... | ... | ... | ... | ... | ... |
| -3 | |
reUSDscrvUSD |
$26.4M | $5.28k | -$22.9M |
| -2 | |
ETHstETH |
$42.6M | $3.41k | -$30.3M |
| -1 | |
ETHstETH |
$99.9M | $9.99k | -$125M |
TVL Winners & Losers
PYUSD and USDS got their own Strategic Reserves pool this week, leading to $25.2M of extra TVL.
| 📍 | Chain | Pool | TVL | Change |
|---|---|---|---|---|
| 1 | |
PYUSD USDS USDS |
$25.2M | +$25.2M |
| 2 | |
 DOLAsUSDe DOLAsUSDe |
$45.7M | +$3.14M |
| 3 | |
USDC crvUSD crvUSD |
$19.2M | +$2.9M |
| ... | ... | ... | ... | ... |
| -1 | |
WETH superOETHb superOETHb |
$98M | -$11.1M |
| 0 | |
 OETHWETH OETHWETH |
$102M | -$13.7M |
| 1 | |
ETHstETH |
$190M | -$27M |
Llamalend Winners & Losers
crvUSD Minting Markets - Borrowing Winners & Losers
WBTC was the preferred asset during the week's volatility, with plain WETH seeing the largest borrowing outflows.
| 📍 | Chain | Market | Collateral | Borrowed | Change |
|---|---|---|---|---|---|
| 1 | |
crvUSDWBTC |
$89M | $46.9M | +$301k |
| 2 | |
crvUSD sfrxETH sfrxETH |
$6.69M | $2.57M | +$77.2k |
| 3 | |
crvUSD weETH weETH |
$4.76M | $1.27M | +$3.9k |
| ... | ... | ... | ... | ... | ... |
| -3 | |
crvUSD wstETH wstETH |
$17.4M | $8.96M | -$234k |
| -2 | |
crvUSD LBTC LBTC |
$256k | $130k | -$289k |
| -1 | |
crvUSDWETH |
$75.2M | $39.1M | -$2.1M |
Lend Markets - Borrowing Winners & Losers
The sreUSD market saw a $4.4M increase in crvUSD supply this week, which spurred over $3.3M in new borrowing as users engaged in profitable yield looping. It also appears that borrowers have migrated from the older sDOLA market to the new, larger market.
| 📍 | Chain | Market | Supplied | Borrowed | Change |
|---|---|---|---|---|---|
| 1 | |
crvUSD sreUSD sreUSD |
$7.36M | $5.57M | +$3.32M |
| 2 | |
crvUSD sDOLA sDOLA |
$30M | $25.7M | +$971k |
| 3 | |
crvUSD CRV CRV |
$4.99M | $3.86M | +$94k |
| ... | ... | ... | ... | ... | ... |
| -3 | |
crvUSDWETH |
$3.5M | $2.4M | -$533k |
| -2 | |
crvUSDsDOLA |
$1.25M | $213k | -$1M |
| -1 | |
crvUSDsUSDe |
$22.9M | $18.2M | -$1.15M |
Lend Markets - Supplying Winners & Losers
As borrowers closed loans for ETH and it's derivatives, crvUSD supply seems to have moved to other markets.
| 📍 | Chain | Market | Supplied | Borrowed | Change |
|---|---|---|---|---|---|
| 1 | |
crvUSDsreUSD |
$7.36M | $5.57M | +$4.4M |
| 2 | |
crvUSDsDOLA |
$30M | $25.7M | +$383k |
| 3 | |
crvUSDynETHx |
$157k | $70.7k | +$83.5k |
| ... | ... | ... | ... | ... | ... |
| -3 | |
crvUSDWETH |
$3.5M | $2.4M | -$277k |
| -2 | |
crvUSDwstETH |
$2.25M | $1.84M | -$285k |
| -1 | |
crvUSDsUSDe |
$22.9M | $18.2M | -$1.46M |
Curve's ecosystem continues to expand rapidly, welcoming new teams and pools weekly. If you're interested in launching a pool, lending market, or simply want to connect with the community, join us on Telegram or Discord.
Risk Disclaimer
References to specific pools or Llamalend markets do not constitute endorsements of their safety. We strongly encourage conducting personal risk analysis before engaging with any pools or markets. Please review our detailed risk disclaimers: Pool Risk Disclaimer, Llamalend Risk Disclaimer, crvUSD Risk Disclaimer.