Curve Best Yields & Key Metrics | Week 38, 2025
Weekly yield and Curve ecosystem metric updates as of the 18th September, 2025

Market Overview
It was a positive week for Curve, here's the news:
- TVL has increased to $2.645B, up 1.8% this week.
- Minted crvUSD is up 5.7% for the week.
- The governance vote for YieldBasis's crvUSD loan is live and ongoing. If it passes, YB is clear to launch next week.
As always, Curve has some great yields available. Check out the highlighted opportunities and metrics below.
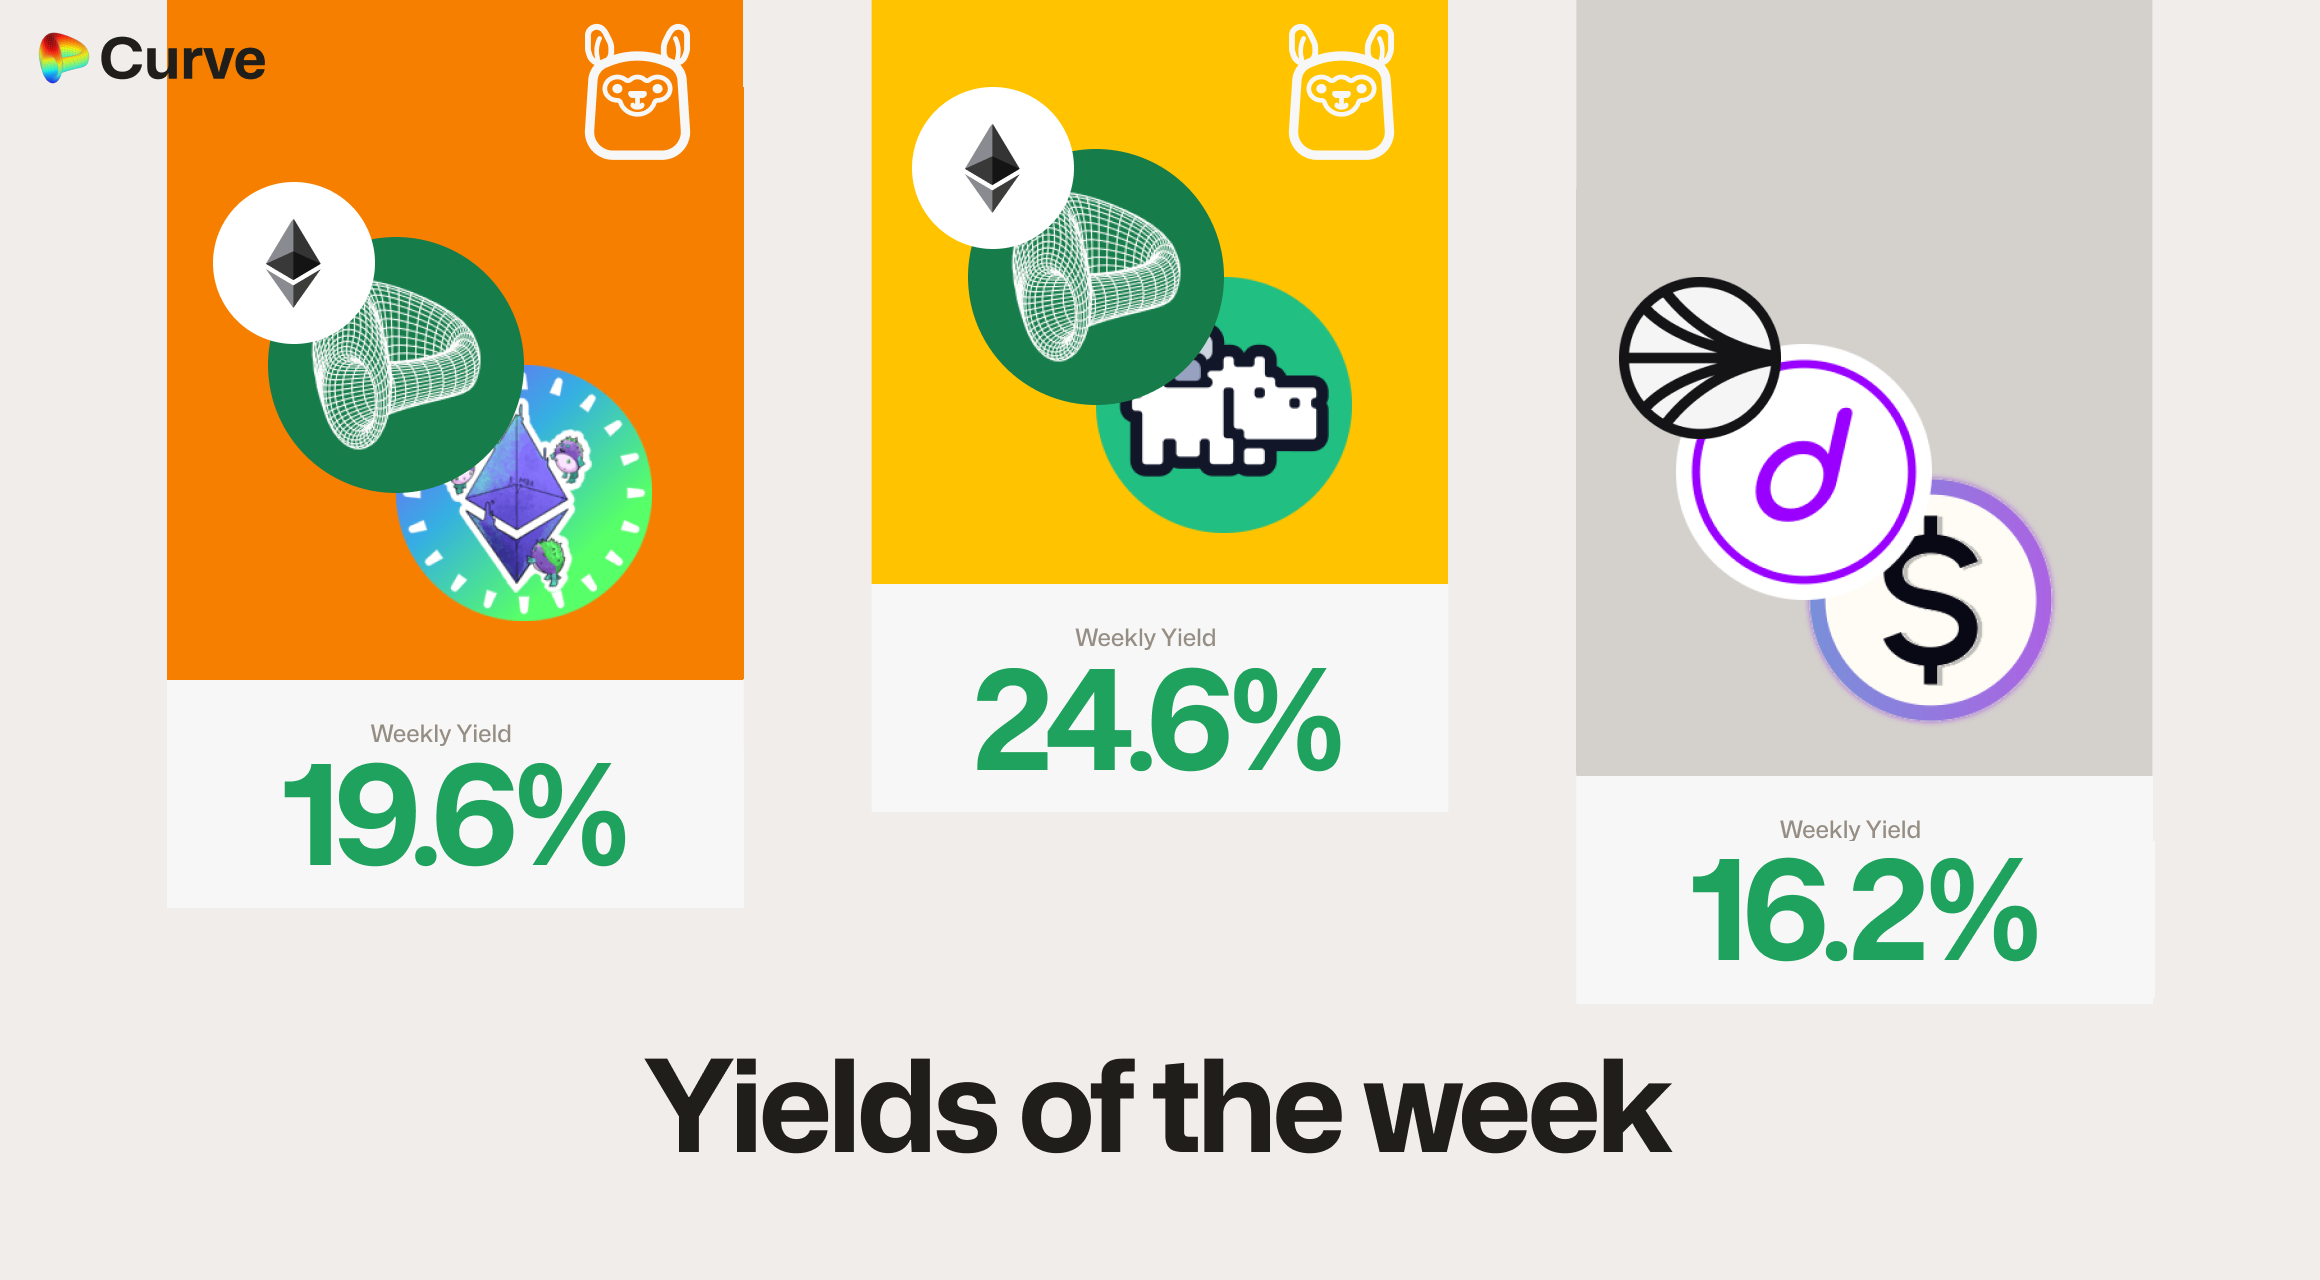
Top Yields
USD Stablecoins
| Chain | Market | Type | Yield |
|---|---|---|---|
 |
 crvUSD crvUSD sreUSD sreUSD |
Llamalend | 24.6% |
|
crvUSD pufETH pufETH |
Llamalend | 19.6% |
 |
 sdUSD sdUSD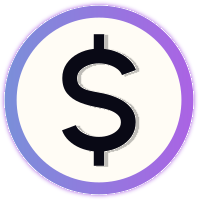 wstkscUSD wstkscUSD |
Pool | 16.2% |
 |
 alUSD alUSD USDC USDC |
Pool | 15.4% |
|
 frxUSD frxUSD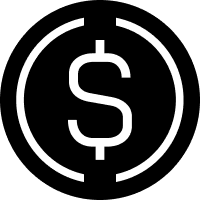 USDe USDe |
Pool | 15.0% |
 |
 miMATIC miMATIC USDC.e USDC.e |
Pool | 13.6% |
|
 crvUSD crvUSD EYWA EYWA |
Llamalend | 13.4% |
|
 WETHUSDC WETHUSDC |
Pool | 12.5% |
 |
 sdUSD sdUSD sfrxUSD sfrxUSD |
Pool | 12.5% |
Top BTC & ETH Yields
| Chain | Market | Asset | Yield |
|---|---|---|---|
|
 frxETH frxETH sfrxETH sfrxETH |
ETH | 5.7% |
|
 sfrxETH sfrxETH rsETH rsETH |
ETH | 5.5% |
|
 uniETH uniETH frxETH frxETH |
ETH | 5.0% |
|
 uniBTC uniBTC brBTC brBTC |
BTC | 3.6% |
|
 WBTCuniBTC WBTCuniBTC |
BTC | 1.8% |
|
 tBTC tBTC cbBTC cbBTC |
BTC | 1.8% |
Other Top Yields
| Chain | Market | Asset | Yield |
|---|---|---|---|
|
 CrossCurve CRV 2 CrossCurve CRV 2 |
CRV | 22.9% |
 |
 CRV CRV crvUSD crvUSD |
CRV | 14.3% |
|
 GHOcbBTC GHOcbBTC WETH WETH |
TRICRYPTO | 6.7% |
|
crvUSD tBTC tBTC WETH WETH |
TRICRYPTO | 6.2% |
|
 EURA EURA EURT EURT EURS EURS |
EUR | 4.2% |
|
EURA EURC EURC |
EUR | 2.3% |
Weekly Metrics
crvUSD & scrvUSD
The amount of crvUSD minted increased by over 5% this week. The peg stability reserves bought back $14M of deployed crvUSD to profit from the very slight depeg and keep the crvUSD peg firm. Because of this slight depeg, the borrow rate has also increased.
| Metric | Value | Change |
|---|---|---|
 crvUSD Minted crvUSD Minted |
$115M | +5.7% |
| Peg Stability Reserves |
$957k | -$14.9M |
 scrvUSD Yield scrvUSD Yield |
6.5% | -3.2% |
| crvUSD inscrvUSD |
47.6% | -3.5% |
| crvUSD Price |
$0.9996 | -$0.0006 |
| Avg. Borrow Rate |
11.9% | +5.5% |
Llamalend
Llamalend's metrics are up across the board this week. Interestingly, the number of loans actually decreased, which suggests the increase is from current users growing their position sizes and supplied amounts.
| Metric | Value | Change |
|---|---|---|
| 🦙 Llamalend TVL | $382M | +5.6% |
| 🦙 Supplied | $109M | +6.7% |
| 🦙 Borrowed | $201M | +5.6% |
| 🦙 Collateral | $359M | +5.3% |
| 🦙 Loans | 1570 | -2 |
DEX
All metrics are higher this week, with the largest increase being the generated fees.
| Metric | Value | Change |
|---|---|---|
| 🔄 TVL | $2.43B | +1.1% |
| 🔄 Volume | $1.62B | +11.4% |
| 🔄 Swaps | 380k | +10.9% |
| 🔄 Total Fees | $328k | +25.0% |
DAO
DAO metrics stayed steady, the CRV price did lift slightly, which increased the value of emissions, but overall these metrics remain very similar to last week.
| Metric | Value | Change |
|---|---|---|
 CRV Circ. Supply CRV Circ. Supply |
1.4B | +0.3% |
| CRV Locked |
866M | -0.2% |
 Total veCRV Total veCRV |
789M | -0.1% |
| veCRV Distribution |
$188k | -1.1% |
| CRV Emissions |
$1.75M (2.22M CRV) | +2.3% |
| Inflation Rate |
5.015% | -0.005% |
DEX Winners & Losers
All metrics are compared to their previous week's value.
Fees Winners & Losers
Ripple's RLUSD/USDC pool had the largest increase in fees this week, with the DAI/USDC/USDT pool a close second and PayPal's PYUSD/USDC pool in third.
| 📍 | Chain | Pool | Volume | Fees | Change |
|---|---|---|---|---|---|
| 1 | |
 USDC USDC RLUSD RLUSD |
$98.4M | $19.7k | +$12.8k |
| 2 | |
 DAIUSDC DAIUSDC USDT USDT |
$122M | $18.3k | +$11k |
| 3 | |
 PYUSDUSDC PYUSDUSDC |
$131M | $13.1k | +$7.93k |
| ... | ... | ... | ... | ... | ... |
| -3 | |
 sUSDe sUSDe sUSDS sUSDS |
$12.5M | $2.5k | -$3.52k |
| -2 | |
WETH INV INV |
$620k | $2.92k | -$4.61k |
| -1 | |
 ELG ELG USDT0 USDT0 |
$620k | $2.92k | -$4.61k |
Volume Winners & Losers
The PYUSD/USDC and DAI/USDC/USDT pools saw a substantial volume increase this week. However, some pools that have been performing well recently saw huge drops in their volumes, such as the sUSDS/USDT and USDT/USDC pools.
| 📍 | Chain | Pool | Volume | Fees | Change |
|---|---|---|---|---|---|
| 1 | |
PYUSDUSDC |
$131M | $13.1k | +$79.3M |
| 2 | |
DAIUSDCUSDT |
$122M | $18.3k | +$73.3M |
| 3 | |
USDCRLUSD |
$98.4M | $19.7k | +$64.2M |
| ... | ... | ... | ... | ... | ... |
| -3 | |
 USDaiUSDC USDaiUSDC |
$39.1M | $3.91k | -$19.3M |
| -2 | |
USDCUSDT |
$52.1M | $521 | -$82.7M |
| -1 | |
sUSDSUSDT |
$78.9M | $789 | -$277M |
TVL Winners & Losers
TVL in ETH pools was up this week, mostly due to the increase in ETH's price. On the other hand, the crvUSD/USDC pool was the biggest loser, losing just under 50% of its TVL, largely because $14M of Peg Stability Reserves were withdrawn.
| 📍 | Chain | Pool | TVL | Change |
|---|---|---|---|---|
| 1 | |
 ETH ETH stETH stETH |
$217M | +$11.5M |
| 2 | |
 OETHWETH OETHWETH |
$117M | +$6.95M |
| 3 | |
 USD0 USD0 USD0++ USD0++ |
$50.4M | +$5.25M |
| ... | ... | ... | ... | ... |
| -3 | |
 sUSDaiUSDC sUSDaiUSDC |
$10.7M | -$4.41M |
| -2 | |
 deUSDUSDC deUSDUSDC |
$8.89M | -$5.65M |
| -1 | |
USDCcrvUSD |
$16.3M | -$15.7M |
Llamalend Winners & Losers
crvUSD Minting Markets - Borrowing Winners & Losers
crvUSD minting markets saw over $5M of new borrows this week, with wstETH being the growth winner.
| 📍 | Chain | Market | Collateral | Borrowed | Change |
|---|---|---|---|---|---|
| 1 | |
crvUSD wstETH wstETH |
$19.6M | $9.19M | +$3.31M |
| 2 | |
crvUSDtBTC |
$27M | $11.7M | +$1.76M |
| 3 | |
crvUSDsfrxETH |
$7.5M | $2.49M | +$745k |
| ... | ... | ... | ... | ... | ... |
| -3 | |
crvUSD LBTC LBTC |
$761k | $419k | +$179 |
| -2 | |
crvUSDsfrxETH |
$726k | $149k | +$77.1 |
| -1 | |
crvUSD weETH weETH |
$5.42M | $1.26M | -$23.2k |
Lend Markets - Borrowing Winners & Losers
It has become a weekly tradition now that the lend markets with the largest supply increases are also the markets with the largest borrowing increases. Demand and supply seem to be moving in unison.
The biggest growth stories this week are the fxSAVE and sreUSD markets, both of which grew substantially in percentage terms.
| 📍 | Chain | Market | Supplied | Borrowed | Change |
|---|---|---|---|---|---|
| 1 | |
crvUSD sDOLA sDOLA |
$30M | $24.8M | +$3.24M |
| 2 | |
crvUSD fxSAVE fxSAVE |
$7.58M | $6.02M | +$2.58M |
| 3 | |
crvUSDsreUSD |
$2.74M | $2.25M | +$2.14M |
| ... | ... | ... | ... | ... | ... |
| -3 | |
crvUSD sfrxUSD sfrxUSD |
$15.3M | $12.6M | -$477k |
| -2 | |
crvUSDsDOLA |
$1.42M | $1.22M | -$579k |
| -1 | |
crvUSDsUSDe |
$24.4M | $19.3M | -$1.84M |
Lend Markets - Supplying Winners & Losers
The weekly winners and losers here are once again almost the same as the winners and losers from the borrowing markets.
| 📍 | Chain | Market | Supplied | Borrowed | Change |
|---|---|---|---|---|---|
| 1 | |
crvUSDsDOLA |
$30M | $24.8M | +$4.43M |
| 2 | |
crvUSDfxSAVE |
$7.58M | $6.02M | +$3.17M |
| 3 | |
crvUSDsreUSD |
$2.74M | $2.25M | +$2.61M |
| ... | ... | ... | ... | ... | ... |
| -3 | |
crvUSDsUSDS |
$1.77M | $1.23M | -$470k |
| -2 | |
crvUSDsDOLA |
$1.42M | $1.22M | -$607k |
| -1 | |
crvUSDsUSDe |
$24.4M | $19.3M | -$2.33M |
Curve's ecosystem continues to expand rapidly, welcoming new teams and pools weekly. If you're interested in launching a pool, lending market, or simply want to connect with the community, join us on Telegram or Discord.
Risk Disclaimer
References to specific pools or Llamalend markets do not constitute endorsements of their safety. We strongly encourage conducting personal risk analysis before engaging with any pools or markets. Please review our detailed risk disclaimers: Pool Risk Disclaimer, Llamalend Risk Disclaimer, crvUSD Risk Disclaimer.