Curve Best Yields & Key Metrics | Week 37, 2025
Weekly yield and Curve ecosystem metric updates as of the 11th September, 2025

Market Overview
It's been a relatively quiet week for Curve, as markets stabilize. This week's news:
- Curve's total TVL is $2.607B, down -0.3% from last week
- A vote for new deployments for FXSwap pools is ongoing, as Curve devs continue to find even more efficiency improvements.
- Curve made a proposal for a new decentralized stablecoin on Hyperliquid called dUSDH to supplement its DEX deployment on Hyperliquid.
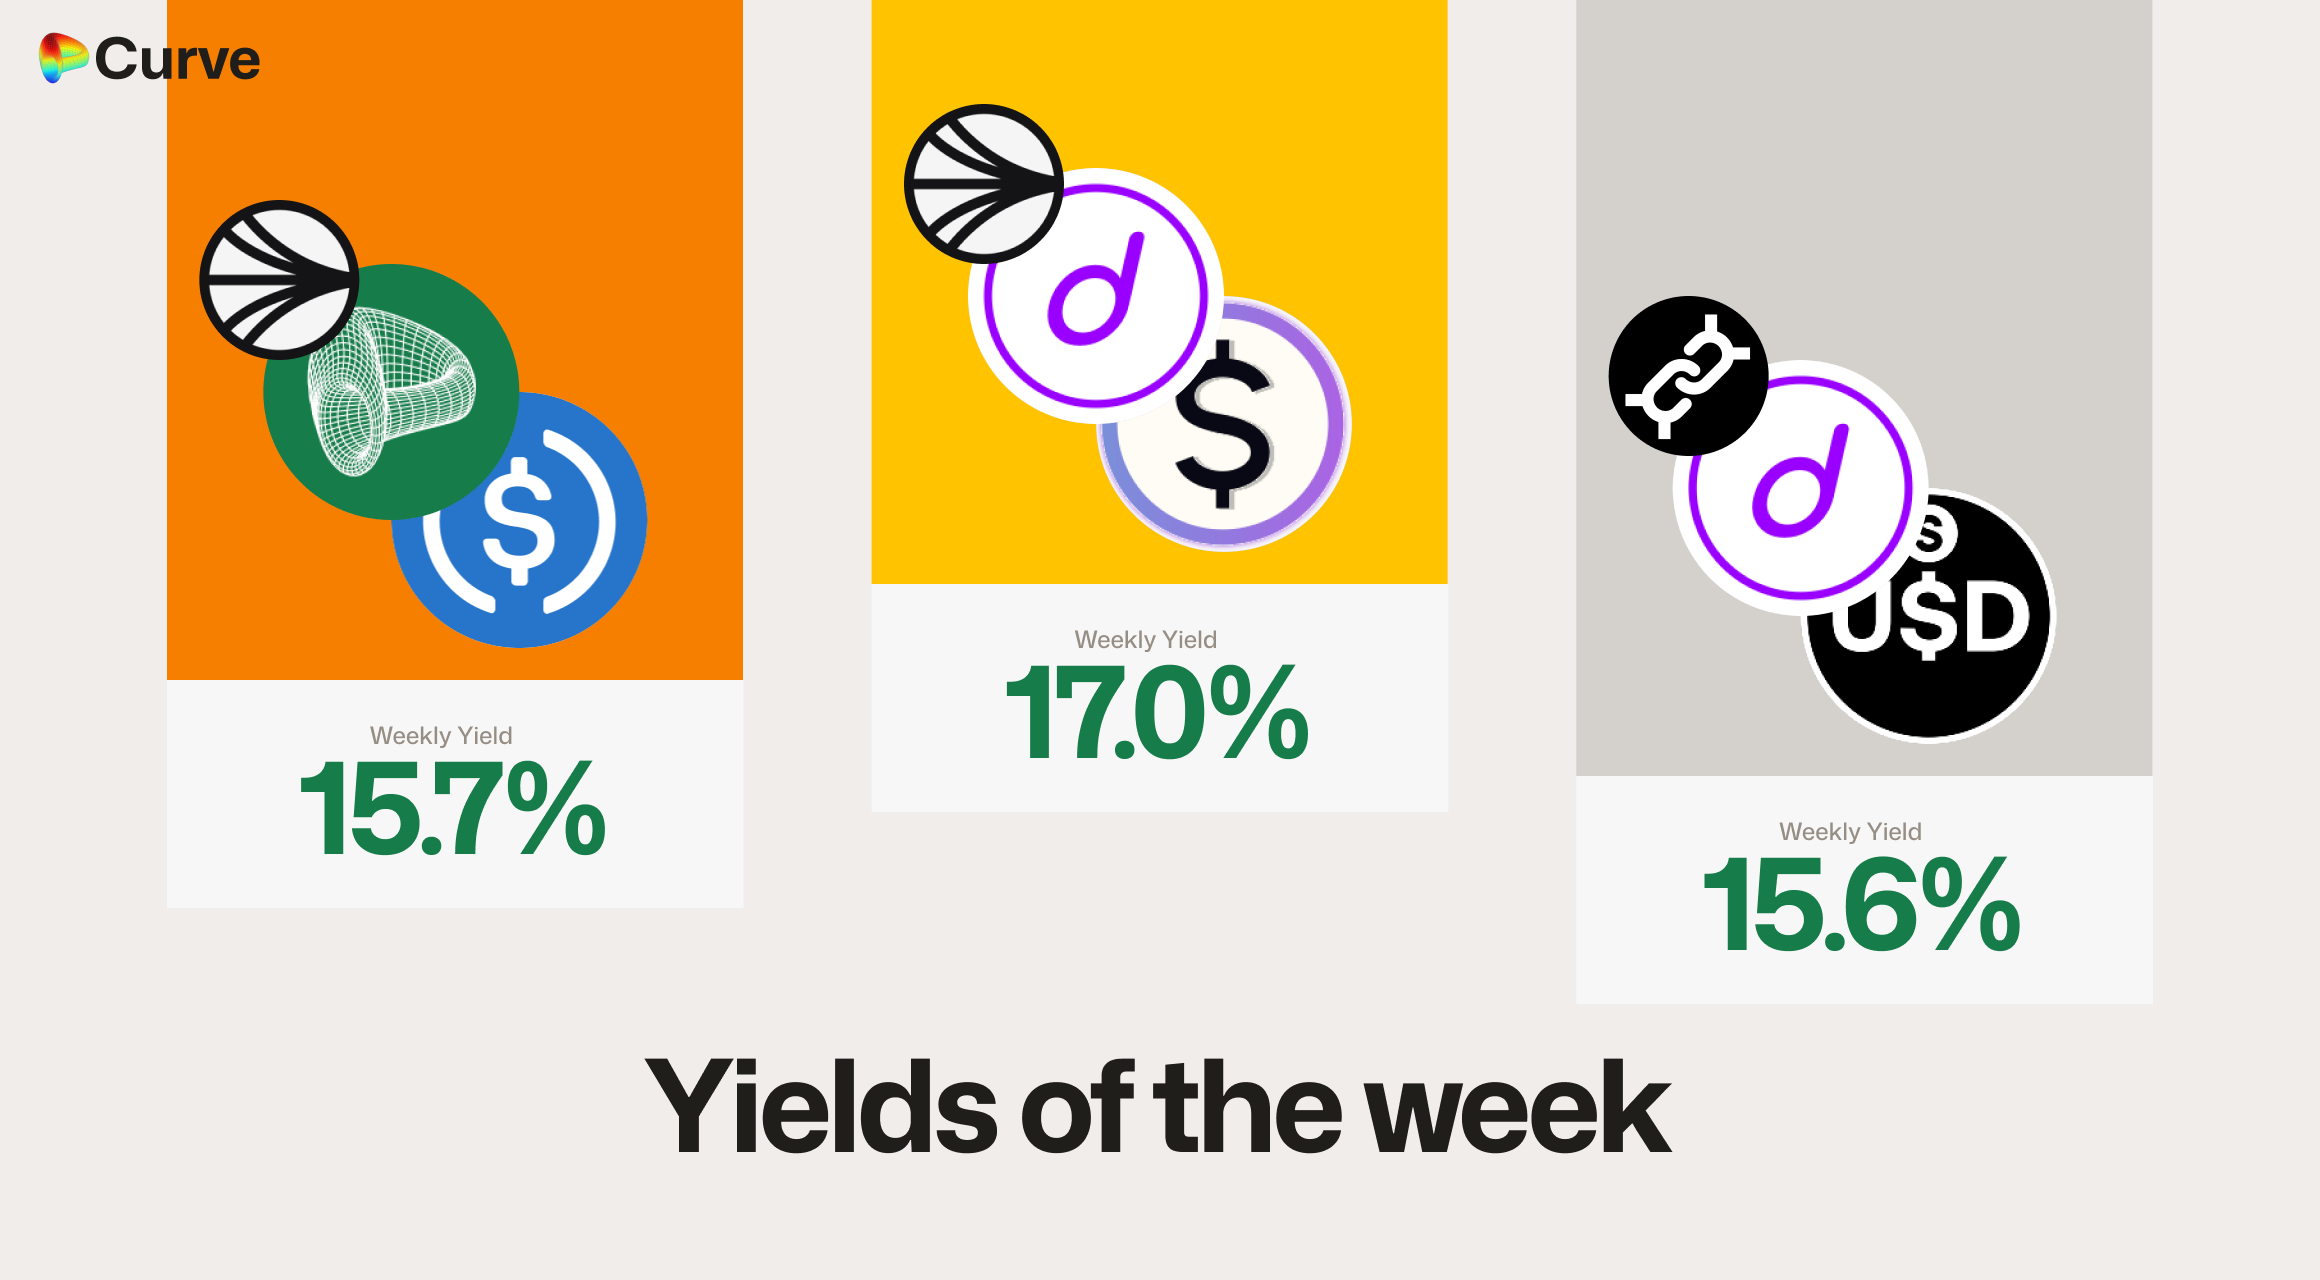
As always, the top highlighted yields of the week are below, along with ecosystem metrics.
Top Yields
USD Stablecoins
| Chain | Market | Type | Yield |
|---|---|---|---|
 |
 sdUSD sdUSD wstkscUSD wstkscUSD |
Pool | 17.0% |
|
 crvUSD crvUSD USDC USDC |
Pool | 15.7% |
 |
 sdUSD sdUSD sfrxUSD sfrxUSD |
Pool | 15.6% |
 |
 crvUSD crvUSD EYWA EYWA |
Llamalend | 15.6% |
|
 alUSD alUSD USDC USDC |
Pool | 15.0% |
 |
 USDC USDC jUSD jUSD |
Pool | 14.8% |
|
 crvUSD crvUSD tBTC tBTC |
Llamalend | 13.6% |
 |
 miMATIC miMATIC USDC.e USDC.e |
Pool | 13.0% |
|
 deUSD deUSD USDT USDT |
Pool | 12.6% |
Top BTC & ETH Yields
| Chain | Market | Asset | Yield |
|---|---|---|---|
|
 WETH WETH tacETH tacETH |
ETH | 6.5% |
|
 msETHWETH msETHWETH |
ETH | 5.6% |
|
 weETH weETH rswETH rswETH |
ETH | 5.4% |
|
 uniBTC uniBTC brBTC brBTC |
BTC | 3.4% |
|
tBTC cbBTC cbBTC |
BTC | 2.6% |
|
 WBTCuniBTC WBTCuniBTC |
BTC | 2.1% |
Other Top Yields
| Chain | Market | Asset | Yield |
|---|---|---|---|
|
 CrossCurve CRV 2 CrossCurve CRV 2 |
CRV | 32.9% |
 |
 CRV CRV crvUSD crvUSD |
CRV | 14.1% |
 |
 crvUSD crvUSD WBTC WBTC WETH WETH |
TRICRYPTO | 12.4% |
|
 GHOcbBTCWETH GHOcbBTCWETH |
TRICRYPTO | 7.1% |
|
 EURA EURA EURT EURT EURS EURS |
EUR | 4.0% |
|
EURA EURC EURC |
EUR | 2.3% |
Weekly Metrics
crvUSD & scrvUSD
Borrowing rates for crvUSD continue to decline. This is a deliberate and automatic action to incentivize more borrowing, as Peg Stability Reserves are deployed to push the crvUSD price lower and help it maintain its peg.
| Metric | Value | Change |
|---|---|---|
 crvUSD Minted crvUSD Minted |
$109M | -2.1% |
| Peg Stability Reserves |
$15.9M | +$4.71M |
 scrvUSD Yield scrvUSD Yield |
9.7% | +0.4% |
| crvUSD inscrvUSD |
51.1% | -0.3% |
| crvUSD Price |
$1.0002 | +$0.0002 |
| Avg. Borrow Rate |
6.4% | -1.0% |
Llamalend
Llamalend's overall TVL increased, driven by strong growth in its stablecoin lending markets.
| Metric | Value | Change |
|---|---|---|
| 🦙 Llamalend TVL | $362M | +1.6% |
| 🦙 Supplied | $102M | +1.2% |
| 🦙 Borrowed | $190M | +0.2% |
| 🦙 Collateral | $341M | +2.1% |
| 🦙 Loans | 1572 | +6 |
DEX
While the total volume increased substantially, the number of swaps dropped significantly. This divergence was driven by a decline in low-value swaps on Fraxtal, while at the same time, the average swap size on Ethereum and Arbitrum increased.
| Metric | Value | Change |
|---|---|---|
| 🔄 TVL | $2.41B | -0.5% |
| 🔄 Volume | $1.45B | +13.8% |
| 🔄 Swaps | 342k | -17.0% |
| 🔄 Total Fees | $263k | -0.8% |
DAO
The DAO saw no significant changes this week, with the CRV price remaining relatively stable. However, veCRV fees did experience a slight drop, primarily due to decreasing crvUSD borrowing rates.
| Metric | Value | Change |
|---|---|---|
 CRV Circ. Supply CRV Circ. Supply |
1.4B | +0.2% |
| CRV Locked |
868M | -0.1% |
 Total veCRV Total veCRV |
790M | -0.2% |
| veCRV Distribution |
$190k | -4.8% |
| CRV Emissions |
$1.71M (2.22M CRV) | -0.1% |
| Inflation Rate |
5.02% | -0.005% |
DEX Winners & Losers
All metrics are compared to their previous week's value.
Fees Winners & Losers
stETH pools saw high volumes again this week, while USDf also experienced significant increases in both volume and fees. In contrast, many Cryptoswap pools had lower volumes and fees due to reduced volatility in their underlying assets.
| 📍 | Chain | Pool | Volume | Fees | Change |
|---|---|---|---|---|---|
| 1 | |
 ETH ETH stETH stETH |
$237M | $23.7k | +$13.5k |
| 2 | |
USDC USDf USDf |
$41.4M | $12.4k | +$9.36k |
| 3 | |
 sUSDe sUSDe sUSDS sUSDS |
$30.1M | $6.03k | +$4.92k |
| ... | ... | ... | ... | ... | ... |
| -3 | |
USDCWBTCWETH |
$18.3M | $8.98k | -$5.59k |
| -2 | |
USDTWBTCWETH |
$16.9M | $19.5k | -$6.77k |
| -1 | |
WETH CVX CVX |
$2.3M | $6.81k | -$12.1k |
Volume Winners & Losers
stETH volume doubled this week. Additionally, the new USDai stablecoin also saw a significant increase in volume, and some USDC↔USDT volume appears to have shifted from the 3pool to the Curve.fi Strategic Reserves pool.
| 📍 | Chain | Pool | Volume | Fees | Change |
|---|---|---|---|---|---|
| 1 | |
ETHstETH |
$237M | $23.7k | +$135M |
| 2 | |
USDCUSDT |
$135M | $1.35k | +$49.6M |
| 3 | |
 USDaiUSDC USDaiUSDC |
$58.4M | $5.84k | +$46.1M |
| ... | ... | ... | ... | ... | ... |
| -3 | |
USDC fxUSD fxUSD |
$22.2M | $2.22k | -$12.9M |
| -2 | |
 cUSDOUSDC cUSDOUSDC |
$7.38M | $1.48k | -$15.5M |
| -1 | |
 DAIUSDCUSDT DAIUSDCUSDT |
$48.5M | $7.27k | -$36.9M |
TVL Winners & Losers
After last week's decline, the TVL of the USDC/crvUSD pool has once again increased. Meanwhile, some DOLA pools were among the week's underperformers.
| 📍 | Chain | Pool | TVL | Change |
|---|---|---|---|---|
| 1 | |
USDCcrvUSD |
$32M | +$6.32M |
| 2 | |
 ETH+WETH ETH+WETH |
$15.2M | +$5.17M |
| 3 |  |
 LBTC LBTC WBTC WBTC |
$11.3M | +$3.82M |
| ... | ... | ... | ... | ... |
| -3 | |
 DOLAsUSDe DOLAsUSDe |
$42.7M | -$7.34M |
| -2 | |
WETHtacETH |
$451k | -$8.21M |
| -1 | |
DOLA USR USR |
$35M | -$10.5M |
Llamalend Winners & Losers
crvUSD Minting Markets - Borrowing Winners & Losers
As crvUSD borrowing rates were high over the last few weeks, we've seen the system work as designed, resulting in net outflows. However, now that the Peg Stability Reserves are being deployed, rates are decreasing, so we expect borrowing to pick up again.
| 📍 | Chain | Market | Collateral | Borrowed | Change |
|---|---|---|---|---|---|
| 1 | |
crvUSDtBTC |
$23.4M | $9.98M | +$94.5k |
| 2 | |
crvUSDweETH |
$5.29M | $1.29M | +$30.1k |
| 3 | |
crvUSDcbBTC |
$3.41M | $1.84M | +$2.79k |
| ... | ... | ... | ... | ... | ... |
| -3 | |
crvUSD sfrxETH sfrxETH |
$7.72M | $1.75M | -$471k |
| -2 | |
crvUSDWETH |
$88.7M | $41M | -$520k |
| -1 | |
crvUSDWBTC |
$89.4M | $46.4M | -$1.04M |
Lend Markets - Borrowing Winners & Losers
Users continue to rotate through stablecoin lending markets in search of the highest yields.
| 📍 | Chain | Market | Supplied | Borrowed | Change |
|---|---|---|---|---|---|
| 1 | |
crvUSD sDOLA sDOLA |
$25.6M | $21.5M | +$3.08M |
| 2 | |
crvUSD fxSAVE fxSAVE |
$4.41M | $3.45M | +$2.29M |
| 3 | |
crvUSDWETH |
$3.91M | $3M | +$129k |
| ... | ... | ... | ... | ... | ... |
| -3 | |
crvUSDsDOLA |
$2.02M | $1.8M | -$436k |
| -2 | |
crvUSDsUSDS |
$2.24M | $1.36M | -$624k |
| -1 | |
crvUSDsUSDe |
$26.7M | $21.2M | -$1.73M |
Lend Markets - Supplying Winners & Losers
Once again, the winners and losers in supplying and borrowing for lending were almost exactly matched. This trend reflects users' ongoing rotation through stablecoin lending markets to find the best yields, with suppliers and borrowers alike moving to optimize their returns.
| 📍 | Chain | Market | Supplied | Borrowed | Change |
|---|---|---|---|---|---|
| 1 | |
crvUSDsDOLA |
$25.6M | $21.5M | +$3.29M |
| 2 | |
crvUSDfxSAVE |
$4.41M | $3.45M | +$2.83M |
| 3 | |
crvUSDWETH |
$3.91M | $3M | +$213k |
| ... | ... | ... | ... | ... | ... |
| -3 | |
crvUSDsUSDS |
$2.24M | $1.36M | -$501k |
| -2 | |
crvUSD sfrxUSD sfrxUSD |
$14.7M | $13.1M | -$1.8M |
| -1 | |
crvUSDsUSDe |
$26.7M | $21.2M | -$2.07M |
Curve's ecosystem continues to expand rapidly, welcoming new teams and pools weekly. If you're interested in launching a pool, lending market, or simply want to connect with the community, join us on Telegram or Discord.
Risk Disclaimer
References to specific pools or Llamalend markets do not constitute endorsements of their safety. We strongly encourage conducting personal risk analysis before engaging with any pools or markets. Please review our detailed risk disclaimers: Pool Risk Disclaimer, Llamalend Risk Disclaimer, crvUSD Risk Disclaimer.