Curve Best Yields & Key Metrics | Week 36, 2025
Weekly yield and Curve ecosystem metric updates as of the 4th September, 2025

Market Overview
Crypto vibes have been a bit low this past week, and unfortunately, Curve is not immune. However, there have been some great developments within Curve and its ecosystem
- Total TVL is $2.67B, down 2.1% from last week.
- The first FXSwap pool is live on BSC, with BBRL (Brazilian Real) and USDC. It is open to all, and deposits are expected to increase over time
- StakeDAO launched their markets V2
- Resupply launched sreUSD
Check out all the weekly metrics and highlighted top yields below.
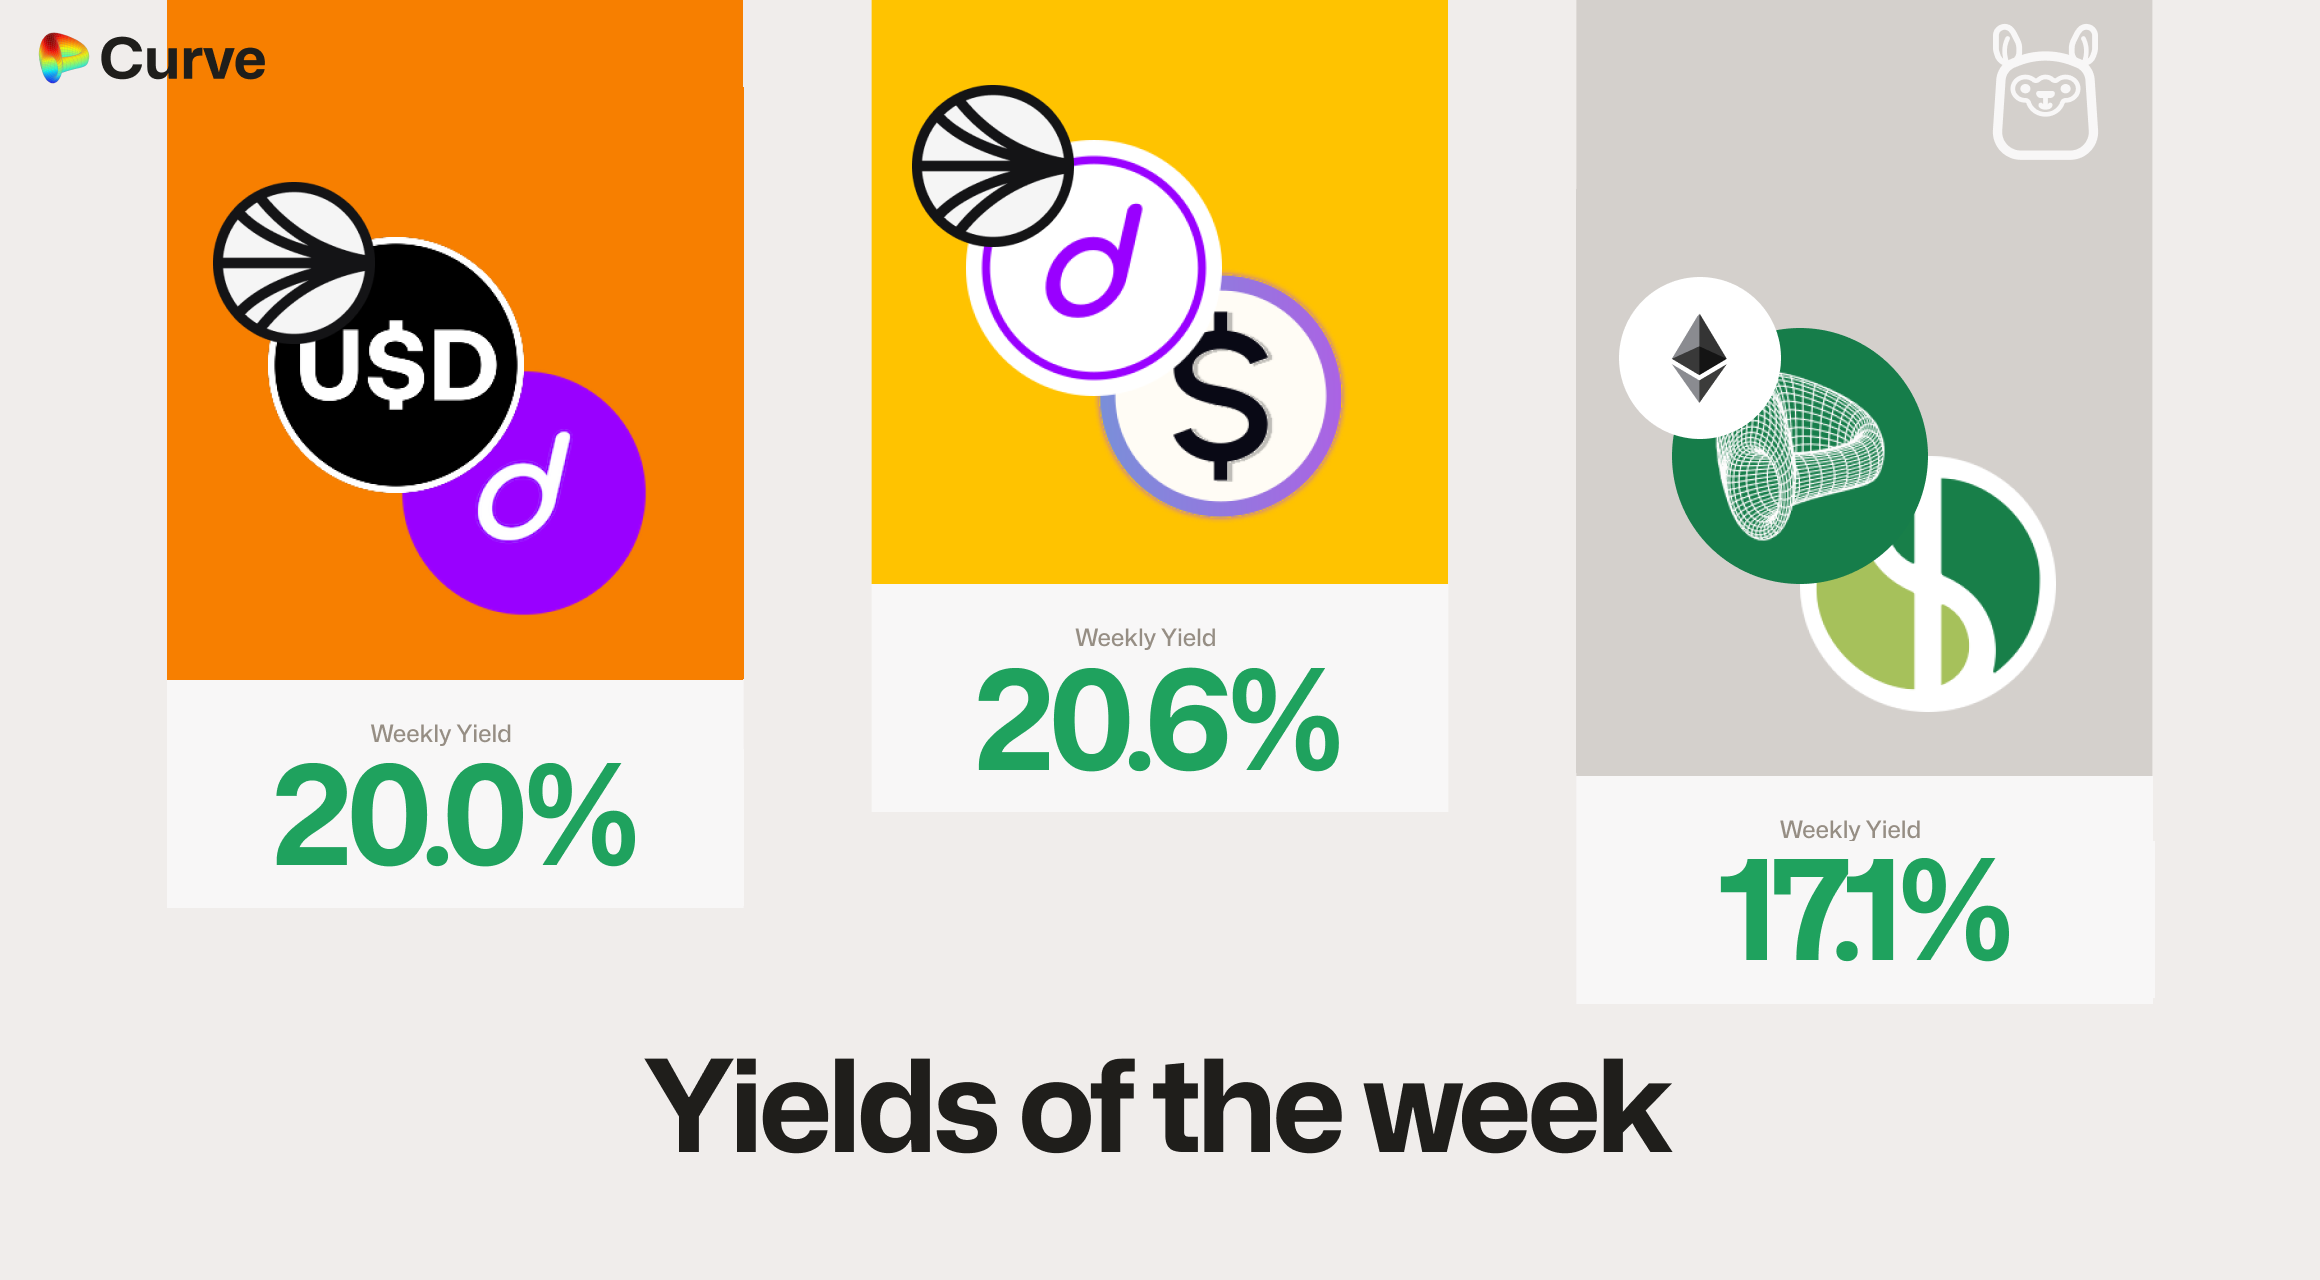
Top Yields
USD Stablecoins
| Chain | Market | Type | Yield |
|---|---|---|---|
 |
 sdUSD sdUSD wstkscUSD wstkscUSD |
Pool | 20.6% |
|
 dUSD dUSD frxUSD frxUSD |
Pool | 20.0% |
 |
 crvUSD crvUSD fxSAVE fxSAVE |
Llamalend | 17.1% |
 |
 sdUSD sdUSD sfrxUSD sfrxUSD |
Pool | 17.0% |
|
 crvUSD crvUSD SQUID SQUID |
Llamalend | 15.4% |
|
 USDC USDC jUSD jUSD |
Pool | 15.2% |
|
 sUSD sUSD sUSDe sUSDe |
Pool | 14.6% |
|
 dUSDsfrxUSD dUSDsfrxUSD |
Pool | 14.4% |
|
 frxUSDdUSD frxUSDdUSD |
Pool | 14.4% |
|
crvUSD tBTC tBTC |
Llamalend | 13.8% |
Top BTC & ETH Yields
| Chain | Market | Asset | Yield |
|---|---|---|---|
|
 ETH+ ETH+ WETH WETH |
ETH | 7.2% |
|
 msETH msETH OETH OETH |
ETH | 6.5% |
|
msETHWETH |
ETH | 6.4% |
|
tBTC cbBTC cbBTC |
BTC | 3.9% |
|
 uniBTC uniBTC brBTC brBTC |
BTC | 3.5% |
|
 WBTCuniBTC WBTCuniBTC |
BTC | 2.6% |
Other Top Yields
| Chain | Market | Asset | Yield |
|---|---|---|---|
|
 CrossCurve CRV 2 CrossCurve CRV 2 |
CRV | 19.4% |
|
 CRVfrxUSD CRVfrxUSD |
CRV | 13.7% |
 |
 crvUSD crvUSD WBTC WBTC WETH WETH |
TRICRYPTO | 11.8% |
|
 GHOcbBTCWETH GHOcbBTCWETH |
TRICRYPTO | 8.9% |
|
 EURA EURA EURT EURT EURS EURS |
EUR | 5.0% |
|
EURA EURC EURC |
EUR | 3.2% |
Weekly Metrics
crvUSD & scrvUSD
Last week, crvUSD borrowing rates increased after peg stability reserves were emptied, which led to some users closing their loans. However, the high rates didn't last long, and peg stability reserves have been redeployed, making it an attractive time to borrow. The scrvUSD yield also remains one of the top available in DeFi.
| Metric | Value | Change |
|---|---|---|
 crvUSD Minted crvUSD Minted |
$111M | -3.9% |
| Peg Stability Reserves |
$11.2M | +$11.2M |
 scrvUSD Yield scrvUSD Yield |
9.4% | +1.2% |
| crvUSD inscrvUSD |
50.7% | +3.1% |
| crvUSD Price |
$0.9999 | -$0.0001 |
| Avg. Borrow Rate |
7.5% | -4.8% |
Llamalend
While a full red week is never nice, it's a good reminder that markets can't be up forever. TVL and loans both decreased, largely due to increased minting rates from crvUSD's peg mechanics, which have now once again decreased.
| Metric | Value | Change |
|---|---|---|
| 🦙 Llamalend TVL | $359M | -4.8% |
| 🦙 Supplied | $99.7M | -4.2% |
| 🦙 Borrowed | $189M | -4.9% |
| 🦙 Collateral | $337M | -5.4% |
| 🦙 Loans | 1567 | -11 |
DEX
After a strong week last week, we've seen lower volumes and fees across the board. While the number of swaps stayed high, the average swap size decreased substantially. TVL, however, remained sticky, which is a good sign of continued user trust and engagement.
| Metric | Value | Change |
|---|---|---|
| 🔄 TVL | $2.43B | -1.4% |
| 🔄 Volume | $1.28B | -40.8% |
| 🔄 Swaps | 413k | -13.2% |
| 🔄 Total Fees | $265k | -40.6% |
DAO
The DAO saw no substantial changes this week. VeCRV distribution decreased, primarily because of a reduction in swap fees. Additionally, the lower crvUSD borrowing rate also contributed to a decrease in overall revenue.
| Metric | Value | Change |
|---|---|---|
 CRV Circ. Supply CRV Circ. Supply |
1.4B | +0.2% |
| CRV Locked |
868M | - |
 Total veCRV Total veCRV |
791M | -0.2% |
| veCRV Distribution |
$200k | -33.9% |
| CRV Emissions |
$1.71M (2.22M CRV) | -9.6% |
| Inflation Rate |
5.025% | -0.005% |
DEX Winners & Losers
All metrics are compared to their previous week's value.
Fees Winners & Losers
Only a few pools saw higher fees this week compared to last week, so it's great to see some new names on the leaderboard.
| 📍 | Chain | Pool | Volume | Fees | Change |
|---|---|---|---|---|---|
| 1 | |
 eCFX eCFX ETH ETH |
$872k | $3.05k | +$1.5k |
| 2 | |
 cUSDOUSDC cUSDOUSDC |
$22.9M | $4.57k | +$1.2k |
| 3 |  |
 USDai USDai USDC USDC |
$12.3M | $1.23k | +$1.14k |
| ... | ... | ... | ... | ... | ... |
| -3 | |
USDCWBTCWETH |
$27.2M | $14.6k | -$13.6k |
| -2 | |
 USDTWBTCWETH USDTWBTCWETH |
$15.1M | $26.2k | -$17.3k |
| -1 | |
 DAIUSDCUSDT DAIUSDCUSDT |
$85.4M | $12.8k | -$24.5k |
Volume Winners & Losers
Because overall volumes were depressed this week, the assets that saw positive change were primarily newcomers, with the USDai pools leading the way.
| 📍 | Chain | Pool | Volume | Fees | Change |
|---|---|---|---|---|---|
| 1 | |
USDaiUSDC |
$12.3M | $1.23k | +$11.4M |
| 2 | |
 sUSDaiUSDC sUSDaiUSDC |
$11.5M | $1.15k | +$6.09M |
| 3 | |
cUSDOUSDC |
$22.9M | $4.57k | +$6M |
| ... | ... | ... | ... | ... | ... |
| -3 | |
USDCUSDT |
$85.2M | $852 | -$104M |
| -2 | |
 sUSDSUSDT sUSDSUSDT |
$356M | $3.56k | -$111M |
| -1 | |
DAIUSDCUSDT |
$85.4M | $12.8k | -$163M |
TVL Winners & Losers
There are also a few new pools within this category, with a new frxUSD pool at the top of the list. It's great to see Curve's TAC deployment getting significant TVL in some of its pools as well.
| 📍 | Chain | Pool | TVL | Change |
|---|---|---|---|---|
| 1 | |
 sfrxUSD sfrxUSD frxUSD frxUSD |
$11.6M | +$11.6M |
| 2 |  |
 uniBTC uniBTC cbBTC cbBTC |
$11.1M | +$9.63M |
| 3 | |
USDCcrvUSD |
$25.7M | +$8.51M |
| ... | ... | ... | ... | ... |
| -3 | |
 reUSD reUSD scrvUSD scrvUSD |
$54M | -$7.52M |
| -2 | |
ETH stETH stETH |
$206M | -$7.58M |
| -1 | |
 ynETHxWETH ynETHxWETH |
$6.24M | -$7.85M |
Llamalend Winners & Losers
crvUSD Minting Markets - Borrowing Winners & Losers
Unfortunately, most crvUSD minting markets were not winners this week. However, it's great to see that the weETH market remains quite positive, even with the high rates we've seen over the past week.
| 📍 | Chain | Market | Collateral | Borrowed | Change |
|---|---|---|---|---|---|
| 1 | |
crvUSD weETH weETH |
$5.2M | $1.26M | +$26.3k |
| 2 | |
crvUSD sfrxETH sfrxETH |
$694k | $148k | +$251 |
| 3 | |
crvUSDsfrxETH |
$7.62M | $2.22M | -$3.08k |
| ... | ... | ... | ... | ... | ... |
| 7 | |
crvUSDWBTC |
$88.9M | $47.5M | -$865k |
| 8 | |
crvUSDcbBTC |
$3.37M | $1.86M | -$1.26M |
| 9 | |
crvUSDWETH |
$89M | $41.5M | -$1.34M |
Lend Markets - Borrowing Winners & Losers
Lending markets are seeing more usage, especially now that the Llamalend displays when you can positively loop your stablecoins for added yield. Negative borrowing rates anyone?
| 📍 | Chain | Market | Supplied | Borrowed | Change |
|---|---|---|---|---|---|
| 1 | |
crvUSD sDOLA sDOLA |
$22.4M | $18.4M | +$645k |
| 2 | |
crvUSDfxSAVE |
$1.47M | $1.17M | +$393k |
| 3 | |
crvUSDWETH |
$3.72M | $2.87M | +$200k |
| ... | ... | ... | ... | ... | ... |
| 76 | |
crvUSDsDOLA |
$2.52M | $2.23M | -$700k |
| 77 | |
crvUSDsUSDe |
$28.2M | $22.9M | -$1.56M |
| 78 | |
crvUSDsfrxUSD |
$16.5M | $13.1M | -$2.09M |
Lend Markets - Supplying Winners & Losers
Interestingly, the top two markets and bottom three markets on this list are identical to those in the borrowing section. This suggests that borrowers and suppliers are actively moving in sync with one another.
| 📍 | Chain | Market | Supplied | Borrowed | Change |
|---|---|---|---|---|---|
| 1 | |
crvUSDsDOLA |
$22.4M | $18.4M | +$876k |
| 2 | |
crvUSDfxSAVE |
$1.47M | $1.17M | +$425k |
| 3 | |
crvUSDWBTC |
$6.19M | $5.14M | +$286k |
| ... | ... | ... | ... | ... | ... |
| 76 | |
crvUSDsDOLA |
$2.52M | $2.23M | -$983k |
| 77 | |
crvUSDsUSDe |
$28.2M | $22.9M | -$1.49M |
| 78 | |
crvUSDsfrxUSD |
$16.5M | $13.1M | -$1.64M |
Curve's ecosystem continues to expand rapidly, welcoming new teams and pools weekly. If you're interested in launching a pool, lending market, or simply want to connect with the community, join us on Telegram or Discord.
Risk Disclaimer
References to specific pools or Llamalend markets do not constitute endorsements of their safety. We strongly encourage conducting personal risk analysis before engaging with any pools or markets. Please review our detailed risk disclaimers: Pool Risk Disclaimer, Llamalend Risk Disclaimer, crvUSD Risk Disclaimer.