Curve Best Yields & Key Metrics | Week 35, 2025
Weekly yield and Curve ecosystem metric updates as of the 28th August, 2025

Market Overview
Curve has had a relatively quiet but good week:
- TVL has increased to $2.732B, up a modest 0.5%
- veCRV holders saw a 25% increase in their distribution this week
- wrapped-Sonic rewards are live for the crvUSD/USDC pool on Sonic, offering huge yields to increase crvUSD liquidity.
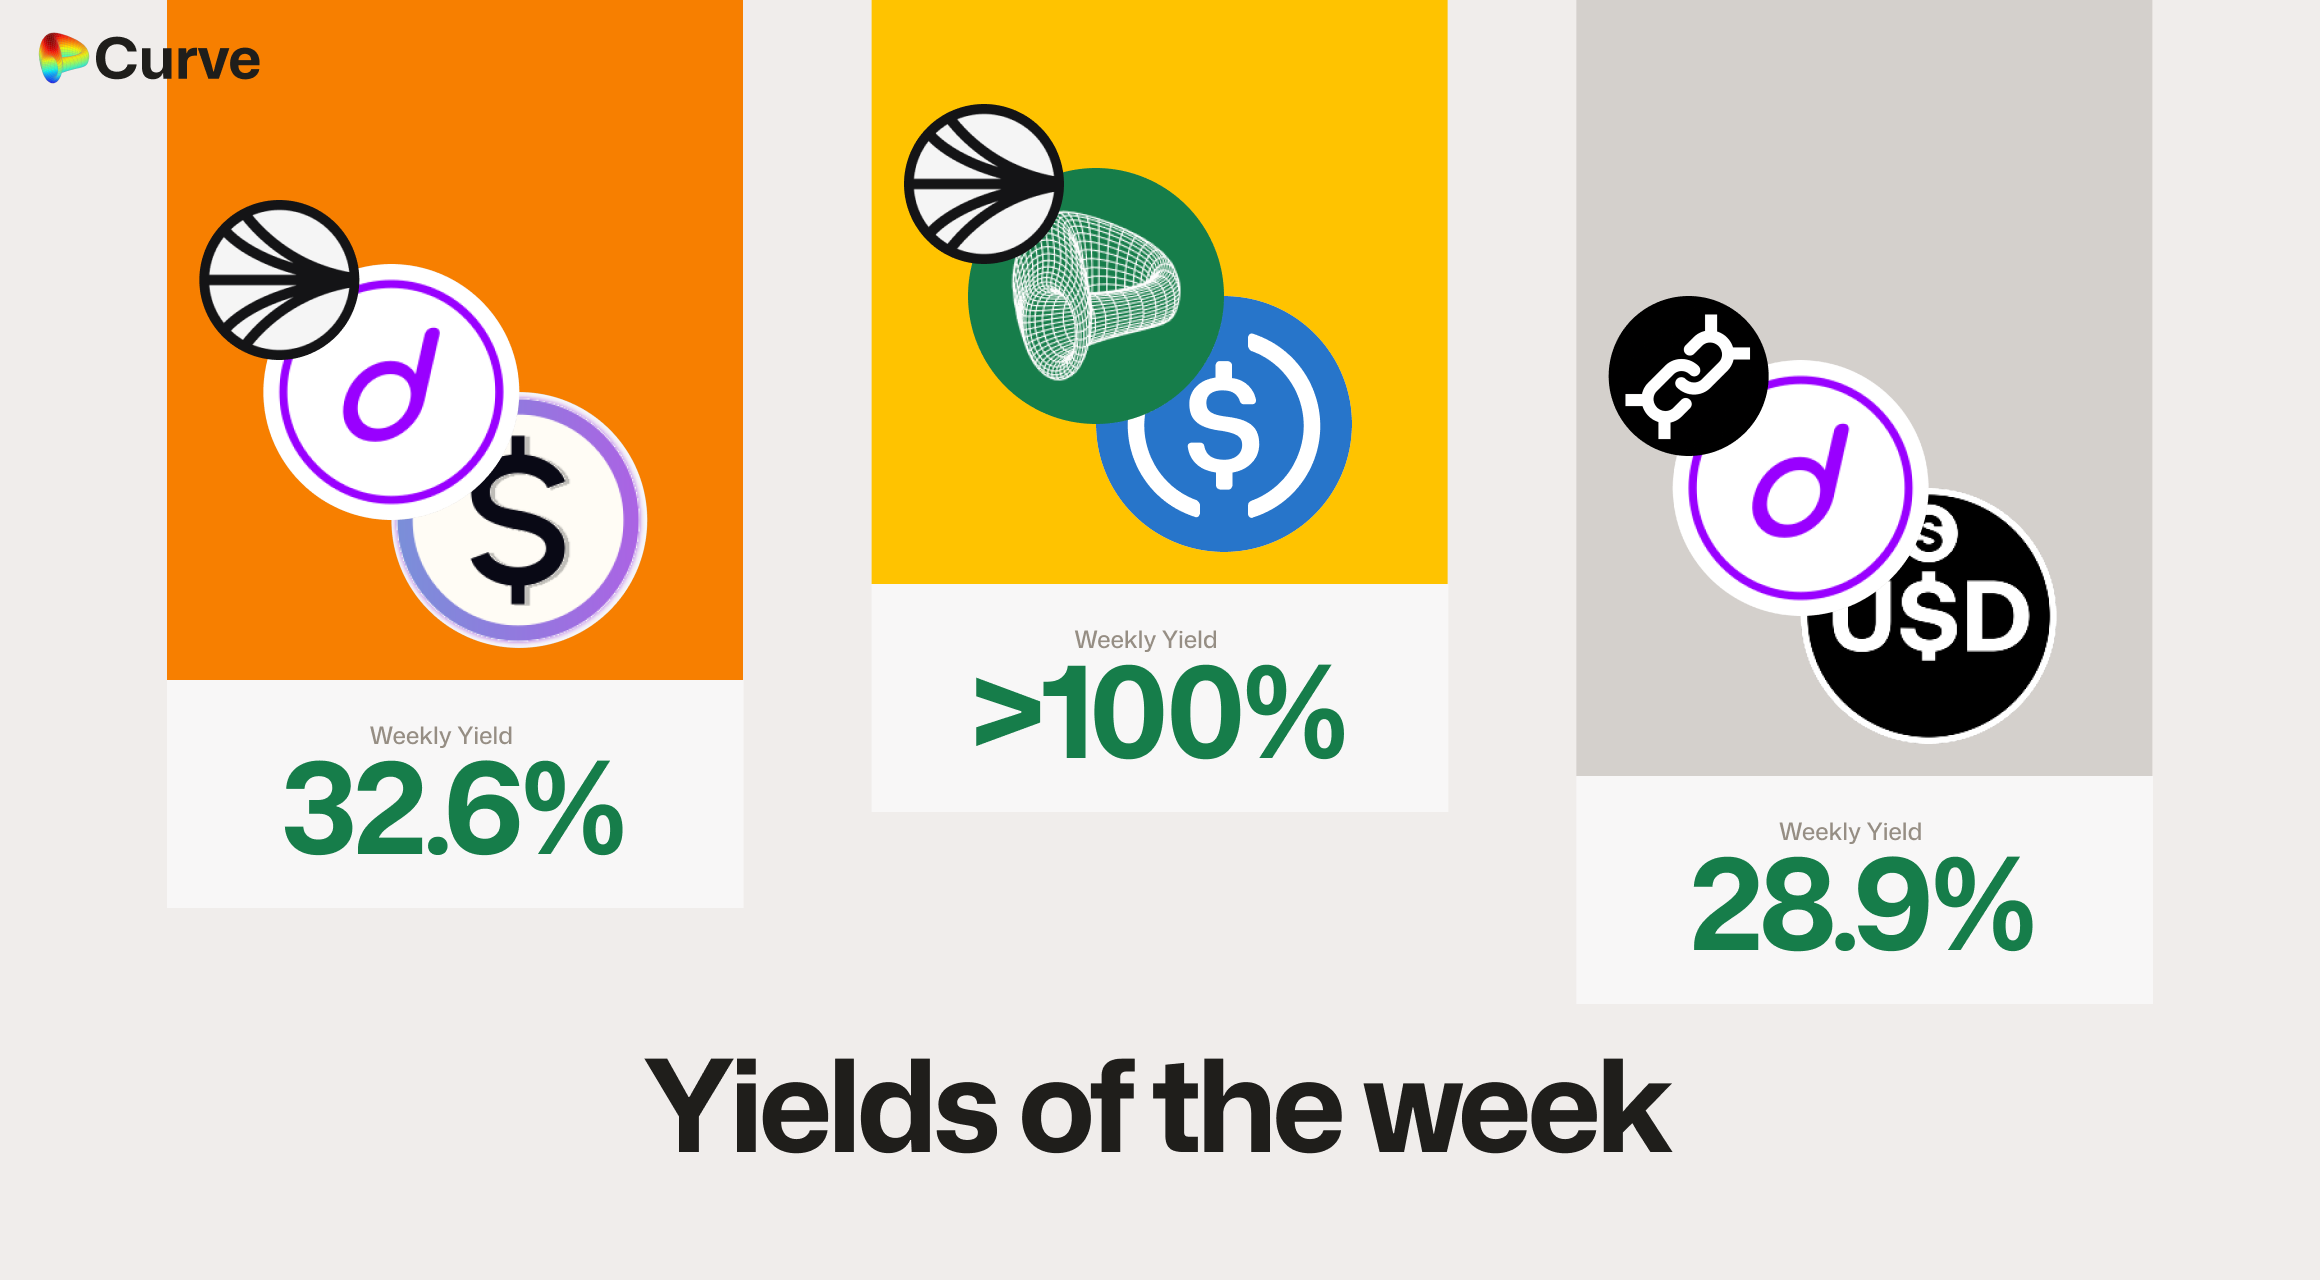
- dTrinity's new staked-dUSD pools are offering more than 30% yields
See all the highlighted yield opportunities and metrics below.
Top Yields
USD Stablecoins
| Chain | Market | Type | Yield |
|---|---|---|---|
 |
 crvUSD crvUSD USDC USDC |
Pool | >100% |
|
 sdUSD sdUSD wstkscUSD wstkscUSD |
Pool | 32.6% |
 |
 sdUSD sdUSD sfrxUSD sfrxUSD |
Pool | 28.9% |
|
 dUSD dUSD frxUSD frxUSD |
Pool | 27.3% |
 |
 USDC USDC jUSD jUSD |
Pool | 26.8% |
|
 frxUSD frxUSD dUSD dUSD |
Pool | 18.9% |
|
 litUSD litUSD sfrxUSD sfrxUSD |
Pool | 18.9% |
|
 crvUSD crvUSD SQUID SQUID |
Llamalend | 17.9% |
|
crvUSDsfrxUSD |
Llamalend | 17.9% |
 |
 alUSD alUSD USDC USDC |
Pool | 14.2% |
Top BTC & ETH Yields
Yields for BTC and ETH pools are compressing. However, over 5% is still very high for both of these assets.
| Chain | Market | Asset | Yield |
|---|---|---|---|
|
 WBTC WBTC uniBTC uniBTC |
BTC | 6.0% |
|
 msETH msETH WETH WETH |
ETH | 5.4% |
|
 weETH weETH rswETH rswETH |
ETH | 5.2% |
|
 frxETH frxETH sfrxETH sfrxETH |
ETH | 5.2% |
|
uniBTC brBTC brBTC |
BTC | 2.8% |
|
 WBTC WBTC tBTC tBTC |
BTC | 2.0% |
Other Top Yields
Once again, CrossCurve pools have the best CRV yield on offer, and Curve still offers higher Euro rates than government bonds.
| Chain | Market | Asset | Yield |
|---|---|---|---|
|
 CrossCurve CRV 2 CrossCurve CRV 2 |
CRV | 24.2% |
|
 CRVfrxUSD CRVfrxUSD |
CRV | 15.6% |
 |
 crvUSD crvUSD WBTC WBTC WETH WETH |
TRICRYPTO | 11.2% |
|
 GHO GHO cbBTCWETH cbBTCWETH |
TRICRYPTO | 8.5% |
|
 EURA EURA EURT EURT EURS EURS |
EUR | 4.3% |
|
EURA EURC EURC |
EUR | 3.3% |
Weekly Metrics
crvUSD & scrvUSD
The borrow rate has skyrocketed to its highest point in months. This is slowly increasing the yield available within scrvUSD, and it should soon exceed 10%, making it one of the highest and safest among DeFi stablecoins.
| Metric | Value | Change |
|---|---|---|
 crvUSD Minted crvUSD Minted |
$116M | -1.2% |
| Peg Stability Reserves |
$22.2k | -$11M |
 scrvUSD Yield scrvUSD Yield |
8.2% | +0.5% |
| crvUSD inscrvUSD |
47.6% | +1.1% |
| crvUSD Price |
$0.9999 | +$0.0003 |
| Avg. Borrow Rate |
12.3% | +4.8% |
Llamalend
Apart from a few suppliers leaving Llamalend this week, there were no significant changes.
| Metric | Value | Change |
|---|---|---|
| 🦙 Llamalend TVL | $378M | -0.4% |
| 🦙 Supplied | $104M | -4.3% |
| 🦙 Borrowed | $199M | -0.8% |
| 🦙 Collateral | $357M | +0.8% |
| 🦙 Loans | 1579 | -15 |
DEX
Swaps were down this week, but TVL, volumes, and fee generation were all higher. It was a strong week for pools and the DEX.
| Metric | Value | Change |
|---|---|---|
| 🔄 TVL | $2.47B | +0.5% |
| 🔄 Volume | $2.16B | +12.2% |
| 🔄 Swaps | 475k | -3.5% |
| 🔄 Total Fees | $446k | +9.8% |
DAO
veCRV holders are rejoicing with a 25% increase in payouts this week, from strong volumes in pools, and higher than usual crvUSD minting rates.
| Metric | Value | Change |
|---|---|---|
 CRV Circ. Supply CRV Circ. Supply |
1.39B | +0.4% |
| CRV Locked |
868M | -0.3% |
 Total veCRV Total veCRV |
793M | -0.1% |
| veCRV Distribution |
$302k | +24.9% |
| CRV Emissions |
$1.89M (2.22M CRV) | -3.5% |
| Inflation Rate |
5.030% | -0.005% |
DEX Winners & Losers
Fees Winners & Losers
The DAI/USDC/USDT pool took the top spot in fee generation this week, with all fees going to the DAO and contributing to the significant weekly veCRV distribution. Volatility in the GEAR token also helped it climb into the top 3, with the Tricrypto pool securing the second spot.
| 📍 | Chain | Pool | Volume | Fees | Change |
|---|---|---|---|---|---|
| 1 | |
 DAIUSDC DAIUSDC USDT USDT |
$249M | $37.3k | +$16.4k |
| 2 | |
USDTWBTCWETH |
$19.8M | $43.6k | +$11.9k |
| 3 | |
 GEAR GEAR ETH ETH |
$3.21M | $12.7k | +$10.1k |
| ... | ... | ... | ... | ... | ... |
| -3 | |
ETH stETH stETH |
$178M | $17.8k | -$4.71k |
| -2 | |
 OGN OGN OUSD OUSD OETH OETH |
$1.2M | $1.76k | -$4.88k |
| -1 | |
 PYUSDUSDC PYUSDUSDC |
$32.7M | $3.27k | -$9.86k |
Volume Winners & Losers
The Spark.fi USDT Reserve won the volume race this week; however, volume isn't everything. The DAI/USDC/USDT pool actually generated nearly 10 times the fees on about half the volume.
| 📍 | Chain | Pool | Volume | Fees | Change |
|---|---|---|---|---|---|
| 1 | |
 sUSDSUSDT sUSDSUSDT |
$467M | $4.67k | +$270M |
| 2 | |
DAIUSDCUSDT |
$249M | $37.3k | +$110M |
| 3 | |
USDCUSDT |
$189M | $1.89k | +$53.7M |
| ... | ... | ... | ... | ... | ... |
| -3 | |
USDT USDe USDe |
$334k | $10 | -$36.9M |
| -2 | |
ETHstETH |
$178M | $17.8k | -$47.1M |
| -1 | |
PYUSDUSDC |
$32.7M | $3.27k | -$98.6M |
TVL Winners & Losers
ETH's appreciation helped TVL within ETH pools rise, but there were also net inflows. Some stablecoin pools saw rotations; however, on a net basis, TVL for pools slightly increased.
| 📍 | Chain | Pool | TVL | Change |
|---|---|---|---|---|
| 1 | |
ETHstETH |
$215M | +$14.3M |
| 2 |  |
 WETH WETH superOETHb superOETHb |
$111M | +$10.5M |
| 3 | |
 deUSDUSDC deUSDUSDC |
$16.7M | +$8.61M |
| ... | ... | ... | ... | ... |
| -3 | |
 USD0 USD0 USD0++ USD0++ |
$41.6M | -$5.43M |
| -2 | |
 reUSD reUSD scrvUSD scrvUSD |
$61.5M | -$6.92M |
| -1 | |
USDC crvUSD crvUSD |
$17.2M | -$14.7M |
Llamalend Winners & Losers
crvUSD Minting Markets - Borrowing Winners & Losers
Users like ETH. Even with the increase in interest rates, three were still over $2M more borrows for the ETH crvUSD minting market. Meanwhile, users seem to be closing BTC loans.
| 📍 | Chain | Market | Collateral | Borrowed | Change |
|---|---|---|---|---|---|
| 1 | |
crvUSD ETH ETH |
$93.4M | $42.8M | +$2.43M |
| 2 | |
crvUSD tBTC tBTC |
$23.6M | $10.2M | +$129k |
| 3 | |
crvUSD sfrxETH sfrxETH |
$725k | $148k | +$258 |
| ... | ... | ... | ... | ... | ... |
| -3 | |
crvUSD wstETH wstETH |
$18.4M | $6.88M | -$118k |
| -2 | |
crvUSDcbBTC |
$5.22M | $3.12M | -$826k |
| -1 | |
crvUSDWBTC |
$92.2M | $48.4M | -$2.83M |
Lend Markets - Borrowing Winners & Losers
Users largely rotated between different staked stablecoin markets this week. In some of these markets, borrower collateral is appreciating faster than crvUSD debt can accrue. sDOLA and fxSAVE are both examples of these markets.
| 📍 | Chain | Market | Supplied | Borrowed | Change |
|---|---|---|---|---|---|
| 1 | |
crvUSD sDOLA sDOLA |
$21.5M | $17.8M | +$1.31M |
| 2 | |
crvUSD fxSAVE fxSAVE |
$1.05M | $782k | +$273k |
| 3 | |
crvUSD CRV CRV |
$4.8M | $3.69M | +$210k |
| ... | ... | ... | ... | ... | ... |
| -3 | |
 crvUSD crvUSD WETH WETH |
$1.31M | $665k | -$112k |
| -2 | |
crvUSDsDOLA |
$3.5M | $2.93M | -$127k |
| -1 | |
crvUSD sUSDe sUSDe |
$29.7M | $24.4M | -$1.43M |
Lend Markets - Supplying Winners & Losers
Suppliers entered the same markets where borrowers' demand for loans began to rise.
| 📍 | Chain | Market | Supplied | Borrowed | Change |
|---|---|---|---|---|---|
| 1 | |
crvUSDsDOLA |
$21.5M | $17.8M | +$967k |
| 2 | |
crvUSDfxSAVE |
$1.05M | $782k | +$381k |
| 3 | |
crvUSD CRV CRV |
$90.4k | $44k | +$15.5k |
| ... | ... | ... | ... | ... | ... |
| -3 | |
crvUSDWBTC |
$5.9M | $5.24M | -$407k |
| -2 | |
crvUSDsfrxUSD |
$18.1M | $15.2M | -$566k |
| -1 | |
crvUSDsUSDe |
$29.7M | $24.4M | -$3.44M |
Curve's ecosystem continues to expand rapidly, welcoming new teams and pools weekly. If you're interested in launching a pool, lending market, or simply want to connect with the community, join us on Telegram or Discord.
Risk Disclaimer
References to specific pools or Llamalend markets do not constitute endorsements of their safety. We strongly encourage conducting personal risk analysis before engaging with any pools or markets. Please review our detailed risk disclaimers: Pool Risk Disclaimer, Llamalend Risk Disclaimer, crvUSD Risk Disclaimer.