Curve Best Yields & Key Metrics | Week 32, 2025
Weekly yield and Curve ecosystem metric updates as of the 7th August, 2025

Market Overview
Green shoots are all around this week. Curve's TVL has increased to $2.585B, up 0.8%. There have also been a few big updates:
- Curve launched on Etherlink, Tezos's native-EVM rollup.
- The Llamalend UI had some major updates, and will continue to change quickly over the coming months to make it easier than ever to lend and borrow.
- It's also the last week of the Curve year, with the 5 year anniversary of the DAO next Thursday, which tprogrammed yearly ~16% CRV emission reduction.
Curve continues to offer strong yields across a wide range of assets. Check them out below, along with this week’s key metrics and the new winners and losers sections for pools and lending markets, highlighting the top and bottom performers across several metrics.
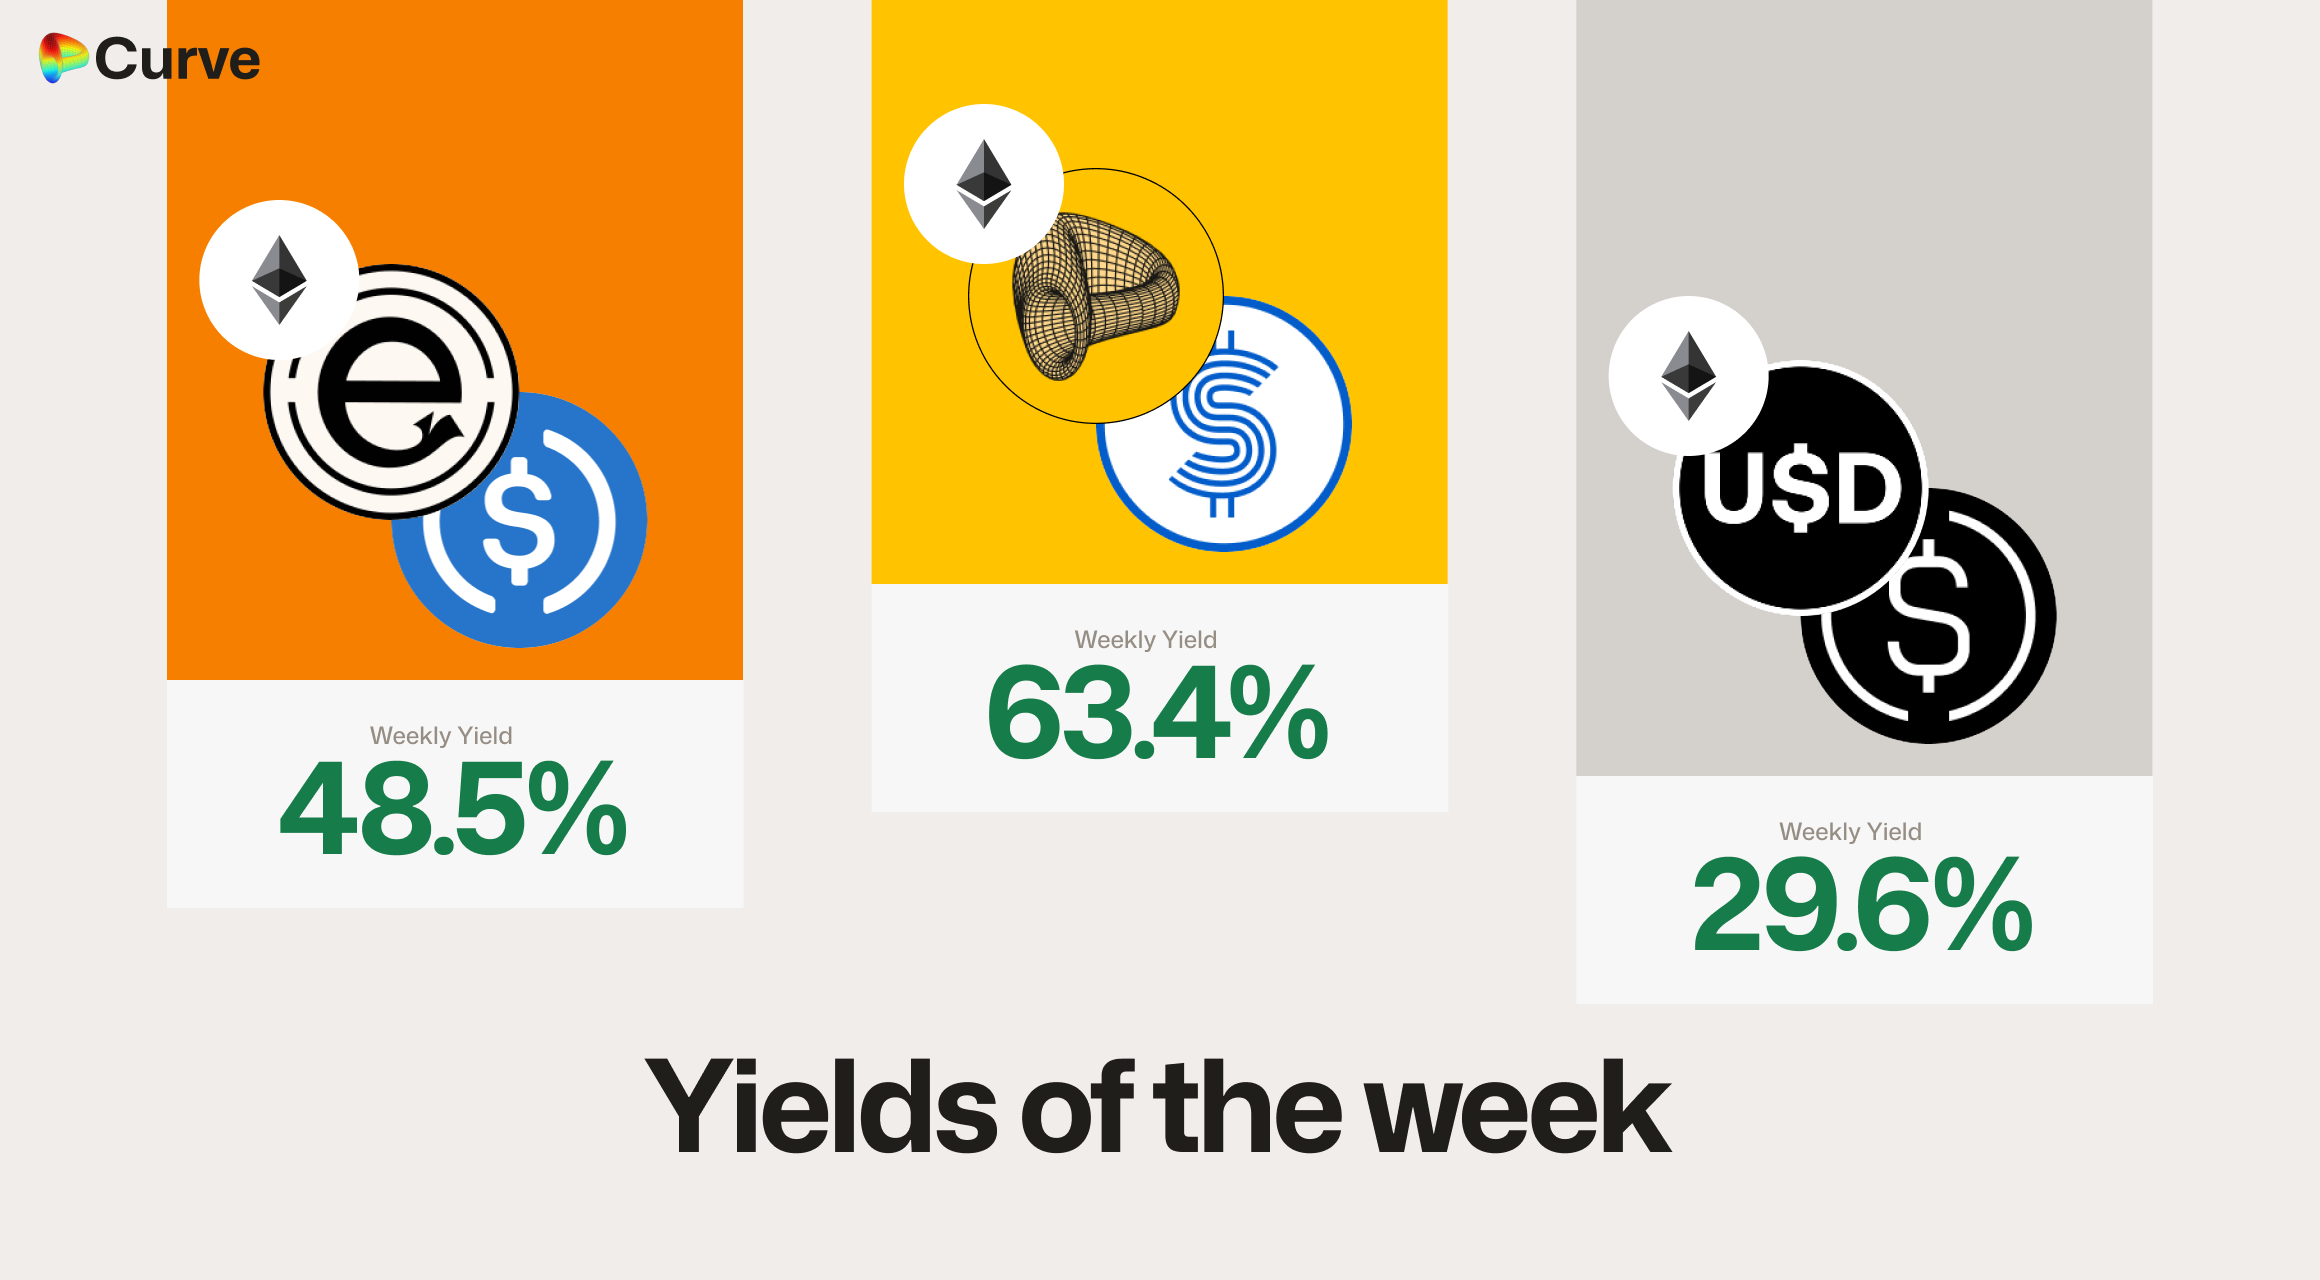
Top Yields
USD Stablecoins
Asymmetry Finance's USDaf has been redeployed, and their scrvUSD/USDaf pool is absolutely printing this week! Also Ebisu's ebUSD is a new entrant to this list. Plenty of options to explore.
| Chain | Market | Type | Yield |
|---|---|---|---|
 |
 scrvUSD scrvUSD USDaf USDaf |
Pool | 63.4% |
|
 ebUSD ebUSD USDC USDC |
Pool | 48.5% |
|
 frxUSD frxUSD USDe USDe |
Pool | 29.6% |
|
 crvUSD crvUSD fxSAVE fxSAVE |
Llamalend | 27.9% |
 |
 axlUSDT axlUSDT USDt USDt |
Pool | 25.1% |
 |
 dUSD dUSD frxUSD frxUSD |
Pool | 25.0% |
 |
 crvUSD crvUSD WETH WETH |
Llamalend | 20.8% |
|
crvUSD ycvxCRV ycvxCRV |
Llamalend | 20.3% |
Top BTC & ETH Yields
Bedrock Technology's uniBTC pool has been constantly the top of this list with more than 12% yield for the last month, and their uniETH pools are also giving great yield.
| Chain | Market | Asset | Yield |
|---|---|---|---|
|
 WBTC WBTC uniBTC uniBTC |
BTC | 14.0% |
|
 uniETH uniETH frxETH frxETH |
ETH | 8.9% |
|
 scETH scETH frxETH frxETH |
ETH | 8.1% |
|
 msETH msETH WETH WETH |
ETH | 7.3% |
|
uniBTC brBTC brBTC |
BTC | 4.2% |
|
 WBTC WBTC tBTC tBTC |
BTC | 2.6% |
Other Top Yields
This section highlights Euro pools, CRV pools, and Tricrypto pools which have a equal and balanced exposure to BTC, ETH, and USD.
| Chain | Market | Asset | Yield |
|---|---|---|---|
 |
 CRV CRV frxUSD frxUSD |
CRV | 22.8% |
 |
 CRV CRV crvUSD crvUSD |
CRV | 19.8% |
|
 GHO GHO cbBTCWETH cbBTCWETH |
TRICRYPTO | 16.2% |
 |
 crvUSD crvUSD WBTC WBTC WETH WETH |
TRICRYPTO | 10.5% |
|
 EURA EURA EURT EURT EURS EURS |
EUR | 5.7% |
|
EURA EURC EURC |
EUR | 3.1% |
Weekly Metrics
crvUSD & scrvUSD
Importantly, crvUSD minted through borrows has increased, possibly due to the borrow rate decreasing, and the peg remains very firm.
| Metric | Value | Change |
|---|---|---|
 crvUSD Minted crvUSD Minted |
$118M | +2.4% |
| Peg Stability Reserves |
$15M | +$2.95M |
 scrvUSD Yield scrvUSD Yield |
6.8% | -0.3% |
| crvUSD inscrvUSD |
47.9% | +2.7% |
| crvUSD Price |
$0.9999 | -$0.0001 |
| Avg. Borrow Rate |
5.9% | -1.3% |
DEX
TVL and volumes both increased this week, but due to dynamic fees and varying structures across pools, higher volumes don’t always result in higher fees. Fees also tend to peak during periods of market stress, which isn’t necessarily a positive sign. This week, volumes were up but overall fees declined, suggesting the activity was healthy and orderly.
| Metric | Value | Change |
|---|---|---|
| 🔄 TVL | $2.32B | +0.6% |
| 🔄 Volume | $2.11B | +4.8% |
| 🔄 Swaps | 476k | -3.8% |
| 🔄 Total Fees | $369k | -22.2% |
Llamalend
Every key metric for Llamalend is up this week, coinciding with a recent UI update. Check it out, and keep an eye out for more improvements in the coming months.
| Metric | Value | Change |
|---|---|---|
| 🦙 Llamalend TVL | $266M | +3.5% |
| 🦙 Supplied | $109M | +6.1% |
| 🦙 Borrowed | $197M | +2.8% |
| 🦙 Collateral | $354M | +2.4% |
| 🦙 Loans | 1626 | +3 |
DAO
This is the last week you will ever see Curve's inflation above 6%, because next week it will automatically decrease ~16%. This means inflation will fall to 5.0%, coinciding with the 5 year DAO anniversary.
The amount distributed to veCRV holders is only down this because last week was a double distribution.
| Metric | Value | Change |
|---|---|---|
 CRV Circ. Supply CRV Circ. Supply |
1.38B | +0.3% |
| CRV Locked |
872M | -0.1% |
 Total veCRV Total veCRV |
792M | -0.4% |
| veCRV Distribution |
$237k | -58.3% |
| CRV Emissions |
$2.42M (2.64M CRV) | -9.9% |
| Inflation Rate |
6.0% | -0.1% |
Pools Winners & Losers
Fees Winners & Losers
Here we compare this week’s top pools for fee generation with last week’s. The pools with the largest increase in fees are shown as the top three winners, while those with the biggest decreases appear as the bottom three losers.
It’s great to see USD stablecoins leading fee generation this week, with a standout performance from Lift Dollar's USDL, which jumped into these top lists for the first time.
| 📍 | Chain | Pool | Volume | Fees | Change |
|---|---|---|---|---|---|
| 1 | |
 sDAI sDAI sUSDe sUSDe |
$75.4M | $15.1k | +$9.37k |
| 2 | |
 USDLUSDC USDLUSDC |
$102M | $10.2k | +$8.61k |
| 3 | |
sUSDe sUSDS sUSDS |
$30.3M | $6.05k | +$2.78k |
| ... | ... | ... | ... | ... | ... |
| 1114 | |
crvUSDWETH CRV CRV |
$26M | $15.9k | -$12.3k |
| 1115 | |
 ETH ETH stETH stETH |
$191M | $19.1k | -$15.8k |
| 1116 | |
WETH CVX CVX |
$10.1M | $33.8k | -$34k |
Volume Winners & Losers
Here we compare this week’s top pools by volume with last week’s. The pools that saw the biggest increase in volume are shown as the top three winners, while those with the largest decreases are the bottom three losers.
Swappers favored USD stablecoins this week, leading to the highest volumes in those pools, with the Spark.fi USDT pool topping the charts. As the ETH staking withdrawal queue continues to ease and stETH regains its peg, volumes in those pools are beginning to decline.
| 📍 | Chain | Pool | Volume | Fees | Change |
|---|---|---|---|---|---|
| 1 | |
sUSDS USDT USDT |
$415M | $4.15k | +$211M |
| 2 | |
USDLUSDC |
$102M | $10.2k | +$86.1M |
| 3 | |
USDCUSDT |
$263M | $2.63k | +$82.1M |
| ... | ... | ... | ... | ... | ... |
| 1114 | |
 tETH tETH weETH weETH |
$4.58M | $916 | -$27.9M |
| 1115 | |
ETHstETH |
$60.8M | $4.87k | -$64.8M |
| 1116 | |
ETHstETH |
$191M | $19.1k | -$158M |
Lending Market Winners & Losers
Borrowing Winners & Losers
Here are the winners and losers in lending markets that saw increases or decreases in the amount borrowed this week.
Staked stablecoin markets continue to lead, with all top markets falling into this category. It’s clear that users are actively searching for yield.
| 📍 | Chain | Market | Supplied | Borrowed | Change |
|---|---|---|---|---|---|
| 1 | |
crvUSDsUSDS |
$4.03M | $2.23M | +$3.71M |
| 2 | |
crvUSDsUSDe |
$32.9M | $25.3M | +$1.93M |
| 3 | |
crvUSD sfrxUSD sfrxUSD |
$21.1M | $16.2M | +$1.27M |
| ... | ... | ... | ... | ... | ... |
| 76 | |
crvUSD wstETH wstETH |
$3.04M | $2.15M | -$192k |
| 77 | |
 crvUSD crvUSD WFRAX WFRAX |
$942k | $520k | -$253k |
| 78 | |
crvUSD sDOLA sDOLA |
$4.21M | $3.37M | -$847k |
Supplying (Lending) Winners & Losers
Here are the winners and losers for lending markets which saw increases or decreases for their amount supplied (lent) for the week.
It's a similar story for the Supplying winners & losers to the borrowed, people are really focusing on trying to max their yields right now.
| 📍 | Chain | Market | Supplied | Borrowed | Change |
|---|---|---|---|---|---|
| 1 | |
crvUSDsUSDS |
$4.03M | $2.23M | +$3.71M |
| 2 | |
crvUSDsUSDe |
$32.9M | $25.3M | +$1.93M |
| 3 | |
crvUSDsfrxUSD |
$21.1M | $16.2M | +$1.27M |
| ... | ... | ... | ... | ... | ... |
| 76 | |
crvUSDwstETH |
$3.04M | $2.15M | -$192k |
| 77 | |
crvUSDWFRAX |
$942k | $520k | -$253k |
| 78 | |
crvUSDsDOLA |
$4.21M | $3.37M | -$847k |
Curve's ecosystem continues to expand rapidly, welcoming new teams and pools weekly. If you're interested in launching a pool, lending market, or simply want to connect with the community, join us on Telegram or Discord.
Risk Disclaimer
References to specific pools or Llamalend markets do not constitute endorsements of their safety. We strongly encourage conducting personal risk analysis before engaging with any pools or markets. Please review our detailed risk disclaimers: Pool Risk Disclaimer, Llamalend Risk Disclaimer, crvUSD Risk Disclaimer.