Curve Best Yields & Key Metrics | Week 30, 2025
Weekly yield and Curve ecosystem metric updates as of the 24th July, 2025

Market Overview
It's been another great week for Curve with total TVL up 3.9% to $2.59B, just below the 12 month ATH of $2.62B.
Volatility in Aave’s ETH borrowing rates has led to the unwinding of leveraged ETH staking positions. This has pushed many CLAMMs out of range and driven large volumes to Curve’s stETH pools, which remain consistently in range.
All metrics are up across the board for Curve’s products. However, due to an issue with automatic crvUSD fee conversion via CowSwap, most of this week’s pool fees will be distributed next week. This explains the drop in veCRV fees for the week.
There are many strong yield opportunities right now, check them out, along with the latest metrics, below.
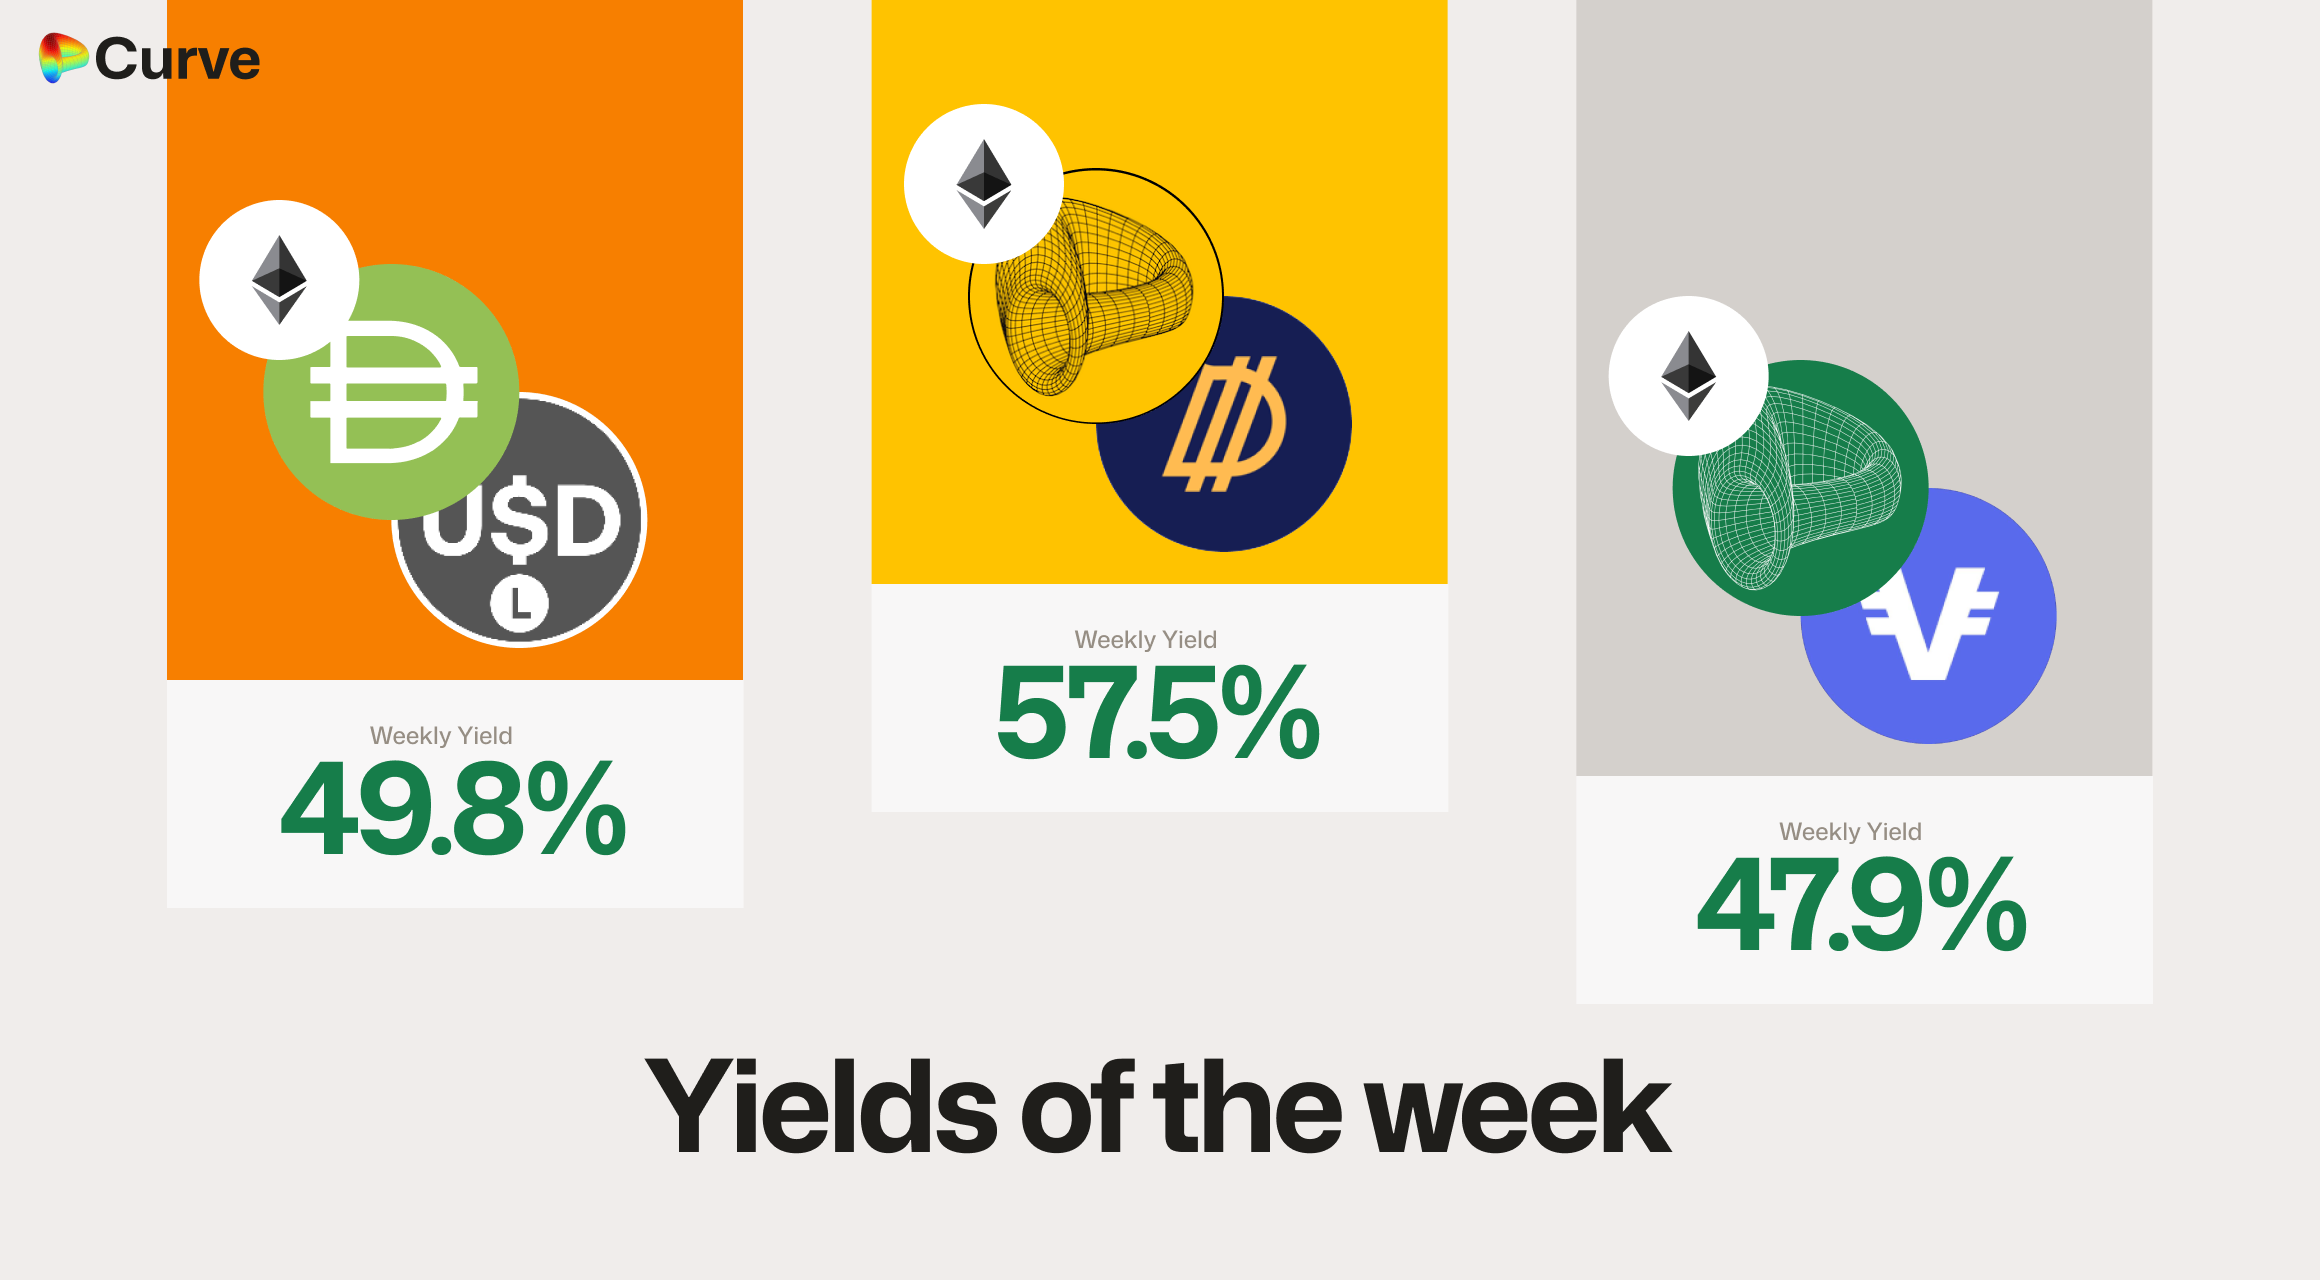
Top Yields
USD Stablecoins
| Chain | Market | Type | Yield |
|---|---|---|---|
 |
 DOLA DOLA scrvUSD scrvUSD |
Pool | 57.5% |
|
 FRAX FRAX sDAI sDAI |
Pool | 49.8% |
|
 crvUSD crvUSD VUSD VUSD |
Pool | 47.9% |
|
 deUSD deUSD USDT USDT |
Pool | 41.3% |
|
 USDC USDC jUSD jUSD |
Pool | 30.0% |
|
deUSDUSDC |
Pool | 29.0% |
|
 sdeUSDdeUSD sdeUSDdeUSD |
Pool | 21.6% |
 |
 frxUSD frxUSD dUSD dUSD |
Pool | 21.1% |
|
 frxUSD frxUSD USDf USDf |
Pool | 20.0% |
 |
 alUSD alUSD USDC USDC |
Pool | 19.6% |
Top BTC & ETH Yields
A great selection of different yields for BTC and ETH this week, with a BTC pool yielding 29%, the highest we've seen while doing this newsletter!
| Chain | Market | Asset | Yield |
|---|---|---|---|
|
 WBTC WBTC uniBTC uniBTC |
BTC | 29.6% |
|
 ETH+ ETH+ WETH WETH |
ETH | 9.7% |
 |
 scETH scETH frxETH frxETH |
ETH | 8.0% |
|
 uniETH uniETH WETH WETH |
ETH | 6.9% |
|
msETHWETH |
ETH | 6.7% |
|
uniBTC brBTC brBTC |
BTC | 5.8% |
|
 tBTC tBTC cbBTC cbBTC |
BTC | 5.4% |
|
 EBTCtBTC EBTCtBTC |
BTC | 3.5% |
Other Top Yields
| Chain | Market | Asset | Yield |
|---|---|---|---|
 |
 CRV CRV crvUSD crvUSD |
CRV | 39.2% |
|
 xCRVsCRV_t xCRVsCRV_t CRV CRV |
CRV | 35.6% |
|
crvUSD tBTC tBTC WETH WETH |
TRICRYPTO | 17.4% |
 |
 crvUSD crvUSD WBTC WBTC WETH WETH |
TRICRYPTO | 16.2% |
|
 EURA EURA EURT EURT EURS EURS |
EUR | 5.5% |
|
EURA EURC EURC |
EUR | 4.6% |
Weekly Metrics
crvUSD & scrvUSD
All metrics are up across the board, except for the scrvUSD yield, which is moderating toward the average crvUSD minting rate.
| Metric | Value | Change |
|---|---|---|
 crvUSD Minted crvUSD Minted |
$116M | +2.6% |
| Peg Stability Reserves |
$12.6M | +$824k |
 scrvUSD Yield scrvUSD Yield |
7.2% | -1.4% |
| crvUSD inscrvUSD |
44.9% | +2.3% |
| crvUSD Price |
$1.0002 | +$0.0002 |
| Avg. Borrow Rate |
7.0% | -0.1% |
DEX
Volumes, fees, swaps, and TVL all increased this week by significant amounts.
| Metric | Value | Change |
|---|---|---|
| 🔄 TVL | $2.34B | +4.1% |
| 🔄 Volume | $2.21B | +42.1% |
| 🔄 Swaps | 498k | +25.0% |
| 🔄 Total Fees | $571k | +35.8% |
Llamalend
Usage in Llamalend has increased, as borrowers and lenders take advantage of the great deals available.
| Metric | Value | Change |
|---|---|---|
| 🦙 Llamalend TVL | $259M | +2.3% |
| 🦙 Supplied | $103M | +3.2% |
| 🦙 Borrowed | $189M | +4.8% |
| 🦙 Collateral | $345M | +3.3% |
| 🦙 Loans | 1612 | +6 |
DAO
This week’s veCRV distribution does not reflect the actual fees generated, due to an issue with automatic crvUSD fee conversion via CowSwap. CRV emissions are valued significantly higher this week, creating many of the yield opportunities currently available.
| Metric | Value | Change |
|---|---|---|
 CRV Circ. Supply CRV Circ. Supply |
1.38B | +0.2% |
| CRV Locked |
873M | - |
 Total veCRV Total veCRV |
799M | +0.3% |
| veCRV Distribution |
$79.6k | -62.1% |
| CRV Emissions |
$2.56M (2.64M CRV) | +44.9% |
| Inflation Rate |
6.0% | -0.1% |
Top Assets by Fees
ETH and USDC retain the top positions, while volatility in CVX pushed it to third place. The standout story this week was the stETH pools, which saw massive volumes as leveraged staking positions were unwound.
Fees here are the total fees paid by traders for access to liquidity.
| 📌 | 🔃 | Asset | Swaps | Volume | Fees |
|---|---|---|---|---|---|
| 1 | - |  ETH ETH |
71.5k | $1.0B | $321.7k |
| 2 | - | USDC |
127.7k | $581.5M | $121.6k |
| 3 | +1 |  CVX CVX |
4.0k | $21.2M | $80.0k |
| 4 | +4 |  stETH stETH |
5.5k | $731.7M | $71.9k |
| 5 | -2 | USDT |
78.1k | $356.1M | $65.0k |
| 6 | +1 | crvUSD |
128.2k | $155.7M | $44.3k |
| 7 | -2 | CRV |
69.2k | $40.9M | $42.9k |
| 8 | -2 |  WBTC WBTC |
13.4k | $35.5M | $25.3k |
| 9 | +2 |  frxETH frxETH |
65.9k | $38.8M | $23.4k |
| 10 | +6 |  RLUSD RLUSD |
118 | $87.8M | $17.5k |
Top Pools by Fees
stETH pools recorded the highest fees among Stableswap pools, as they were among the few in DeFi with consistently in-range liquidity. Market volatility also led to significant fees and volume across many Cryptoswap pools.
Fees here are the total fees paid by traders for access to liquidity.
| 📌 | 🔃 | Chain | Pool | Swaps | Volume | Fees |
|---|---|---|---|---|---|---|
| 1 | - | |
WETHCVX |
2.7k | $16.6M | $64.1k |
| 2 | +9 | |
ETHstETH |
3.2k | $550.1M | $55.0k |
| 3 | +2 | |
WETHUSDC |
8.7k | $3.5M | $34.8k |
| 4 | - | |
crvUSDWETH CRV CRV |
9.2k | $37.1M | $31.4k |
| 5 | -3 | |
USDTWBTCWETH |
1.2k | $5.7M | $30.0k |
| 6 | -3 | |
 DAIUSDCUSDT DAIUSDCUSDT |
1.8k | $128.1M | $19.2k |
| 7 | -1 | |
USDCWBTCWETH |
5.9k | $32.4M | $18.8k |
| 8 | - | |
USDTWBTCWETH |
5.1k | $30.4M | $18.1k |
| 9 | +1 | |
USDCRLUSD |
118 | $87.4M | $17.5k |
| 10 | +3 | |
frxETHCVX |
959 | $3.7M | $14.1k |
Curve's ecosystem continues to expand rapidly, welcoming new teams and pools weekly. If you're interested in launching a pool, lending market, or simply want to connect with the community, join us on Telegram or Discord.
Risk Disclaimer
References to specific pools or Llamalend markets do not constitute endorsements of their safety. We strongly encourage conducting personal risk analysis before engaging with any pools or markets. Please review our detailed risk disclaimers: Pool Risk Disclaimer, Llamalend Risk Disclaimer, crvUSD Risk Disclaimer.