Curve Best Yields & Key Metrics | Week 28, 2025
Weekly yield and Curve ecosystem metric updates as of the 10th July, 2025

Market Overview
Curve’s TVL rose 2.7% to $2.23B this week, as Ethereum and battle-tested DeFi start to gain some positive momentum, and BTC celebrates a new All Time High!
There are some great yields to take advantage of this week, including many for USD, BTC and ETH stablecoin pools. This update highlights those opportunities along with key weekly metrics from across the Curve ecosystem.
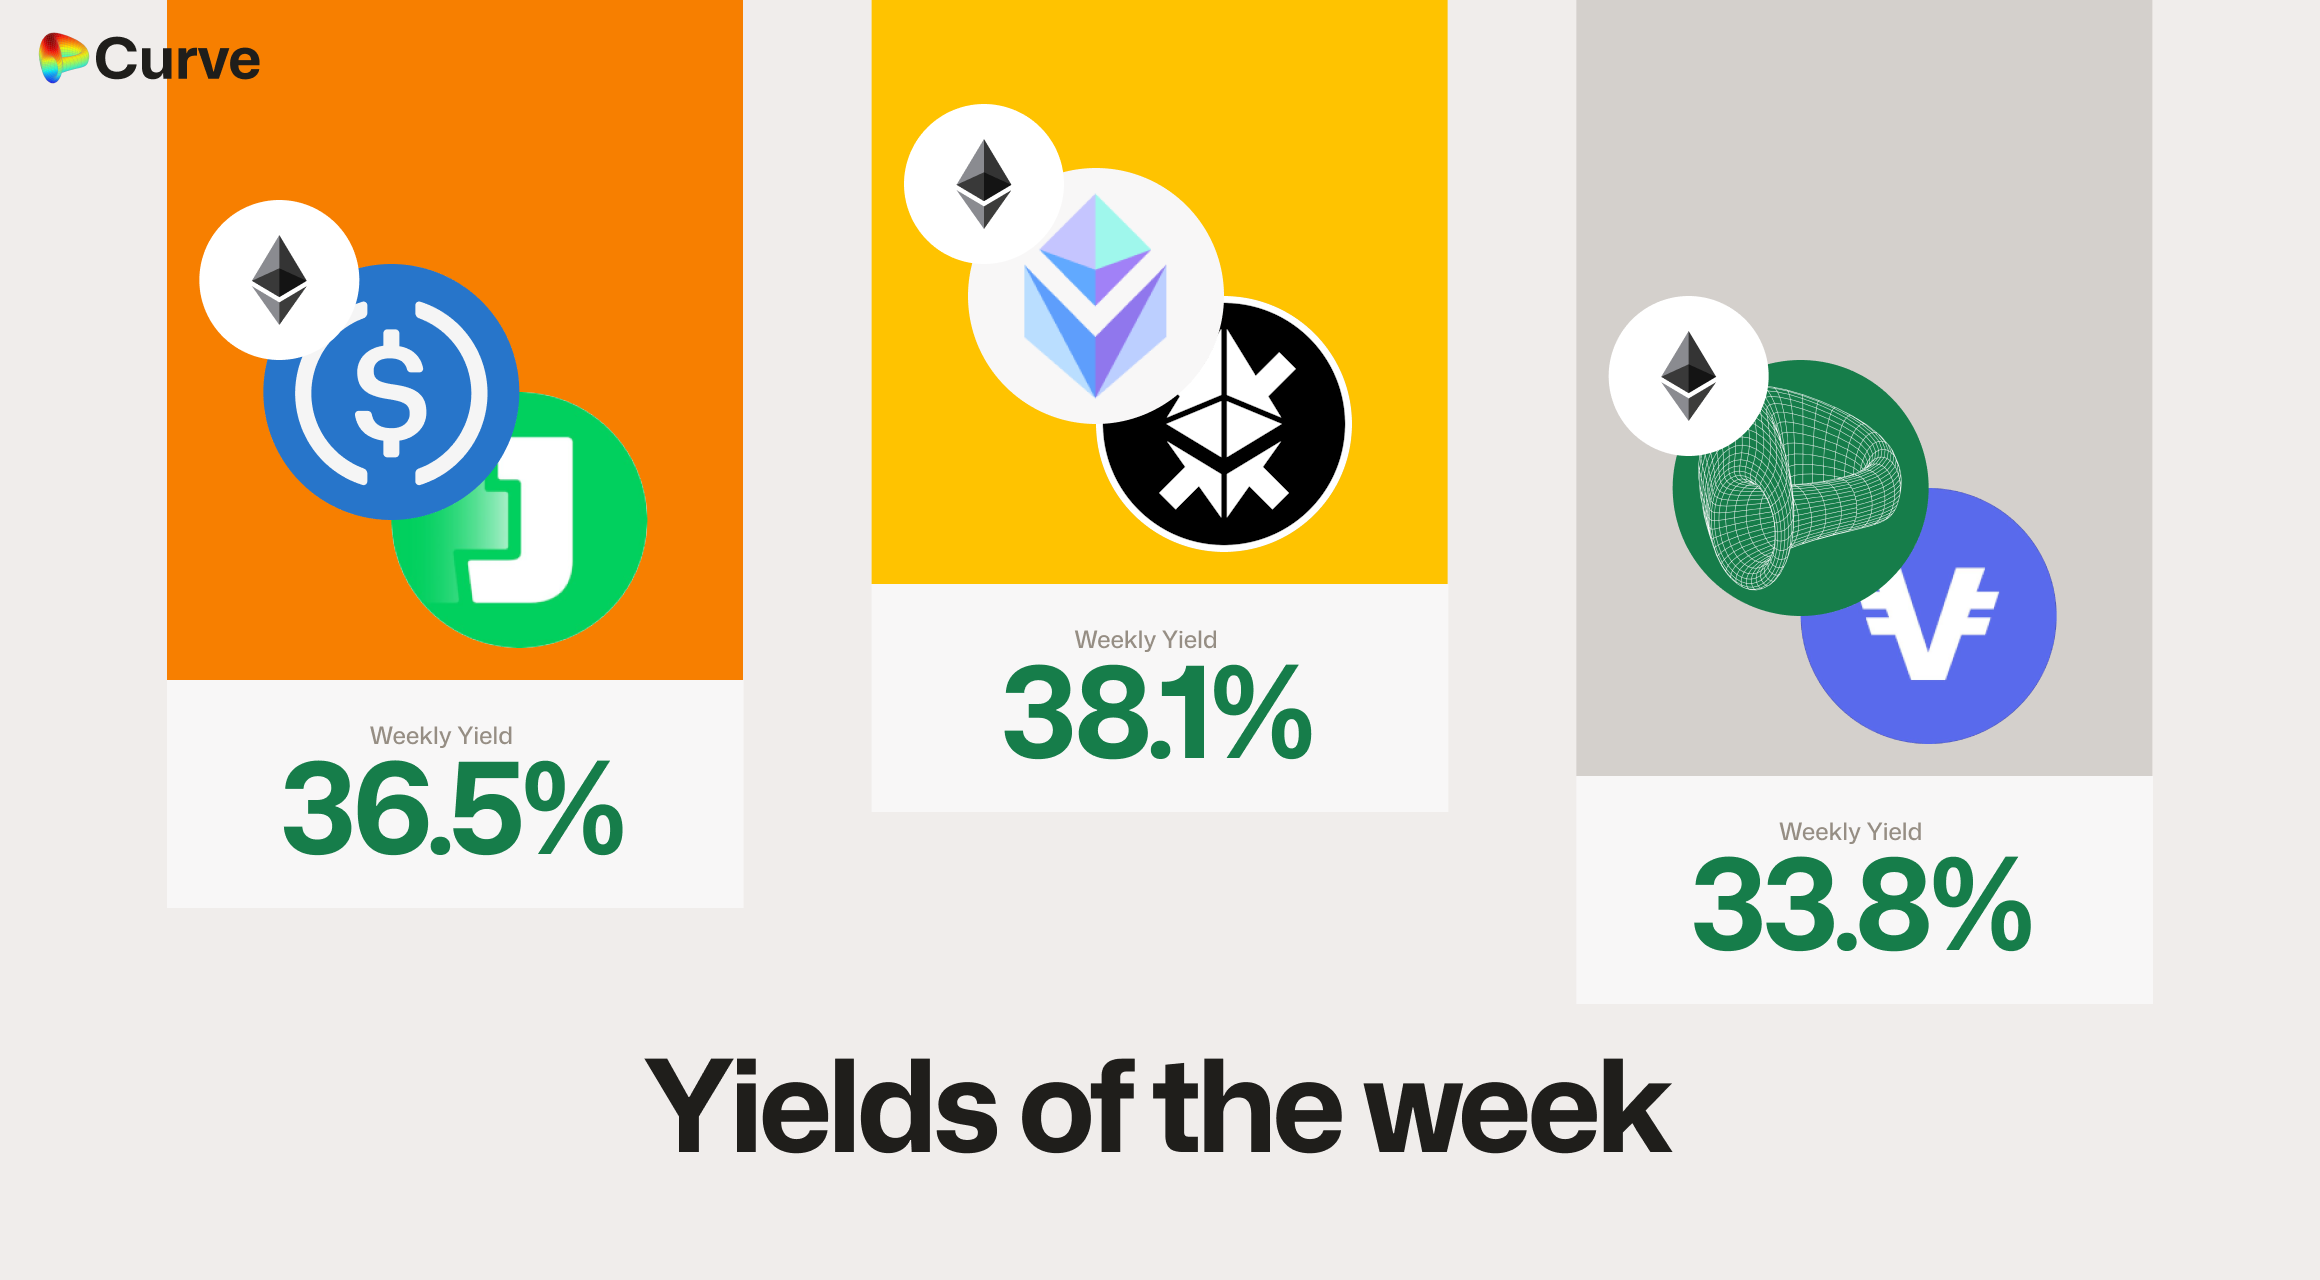
Top Yields
USD Stablecoins
Note: The jUSD/USDC pool below shows a yield above 36.5%, but this has been adjusted based on the assumption that $100K is staked in its gauge. At the time of writing, only $45K of the $1M in the pool is actually staked.
| Chain | Pool | Market | Yield |
|---|---|---|---|
 |
 USDC USDC jUSD jUSD |
Pool | 36.5% |
|
 crvUSD crvUSD VUSD VUSD |
Pool | 33.8% |
|
 USD3 USD3 sUSDS sUSDS |
Pool | 29.9% |
|
 frxUSD frxUSD USDf USDf |
Pool | 26.0% |
 |
 alUSD alUSD USDC USDC |
Pool | 23.3% |
|
 sfrxUSD sfrxUSD scrvUSD scrvUSD |
Pool | 22.4% |
|
USDCUSDf |
Pool | 17.8% |
 |
 crvUSD crvUSD USDT USDT |
Pool | 13.4% |
|
crvUSD USDC USDC |
Pool | 13.1% |
 |
 frxUSD frxUSD dUSD dUSD |
Pool | 12.2% |
Top BTC & ETH Yields
| Chain | Pool | Asset | Market | Yield |
|---|---|---|---|---|
|
 uniETH uniETH frxETH frxETH |
ETH | Pool | 38.1% |
|
uniETH WETH WETH |
ETH | Pool | 18.6% |
|
 WBTC WBTC uniBTC uniBTC |
BTC | Pool | 12.8% |
|
 ETH+WETH ETH+WETH |
ETH | Pool | 10.3% |
|
frxETH OETH OETH |
ETH | Pool | 6.9% |
|
 EBTC EBTC tBTC tBTC |
BTC | Pool | 4.5% |
|
 tacBTC tacBTC cbBTC cbBTC FBTC FBTC |
BTC | Pool | 3.4% |
|
 WBTC WBTC tBTC tBTC |
BTC | Pool | 2.0% |
Weekly Metrics
crvUSD & scrvUSD
crvUSD supply declined slightly this week, which is expected given the recent high borrow rates. However, the peg remains strong, and there’s optimism ahead with Yield Basis coming soon and Resupply stabilizing, and moving forward positively.
| Metric | Value | Change |
|---|---|---|
| crvUSD Total Supply |
$120M | -3.3% |
| crvUSD Borrowed |
$108M | -8.2% |
| Peg Stability Reserves |
$11.7M | +$5.7M |
| scrvUSD Yield |
7.2% APY | +1.0% |
| crvUSD inscrvUSD |
45.8% | +3.4% |
| crvUSD Peg |
$1.0000 | +$0.0002 |
| Avg. Borrow Rate |
7.0% | -1.3% |
| Loans |
743 | -11 |
| Fees |
$180k | +21.3% |
DEX
Last week was relatively quiet, so it’s expected to see swap-related metrics down across the board. However, TVL is up on the week, which is a positive signal for the ecosystem.
| Metric | Value | Change |
|---|---|---|
| 🔄 TVL | $2.02B | +3.0% |
| 🔄 Volume | $1.02B | -30.1% |
| 🔄 Swaps | 313k | -21.3% |
| 🔄 Total Fees | $202k | -24.6% |
Llamalend
Lending TVL and supplied assets awaiting borrowers increased this week, while borrowed amounts and collateral saw slight declines. Overall, the market appears to be stabilizing, and an almost 7% increase in the number of loans signals new users are testing the system.
| Metric | Value | Change |
|---|---|---|
| 🦙 Lending TVL | $110M | +0.9% |
| 🦙 Supplied | $90.5M | +0.1% |
| 🦙 Borrowed | $63.4M | -6.5% |
| 🦙 Collateral | $82.5M | -4.1% |
| 🦙 Loans | 859 | +55 |
Top Assets by Fees
This week, instead of focusing on the highest-volume assets, we’re highlighting the assets that generated the most fees. These figures represent the total raw fees paid by all swappers, both into and out of each asset, so each swap is effectively double-counted.
USDf ranks high this week, reflecting strong fee generation, and CVX also appears to be in high demand, along with WETH dethroning USDC for the top spot.
| Position | Change | Asset | Swaps | Volume | Fees |
|---|---|---|---|---|---|
| 1 | +1 |  WETH WETH |
32.2k | $124.4M | $69.3k |
| 2 | -1 | USDC |
88.8k | $446.4M | $59.4k |
| 3 | - |  USDT USDT |
38.3k | $342.4M | $39.1k |
| 4 | - |  crvUSD crvUSD |
70.5k | $80.3M | $14.8k |
| 5 | +3 |  WBTC WBTC |
6.7k | $24.9M | $13.9k |
| 6 | +12 |  CVX CVX |
1.1k | $3.2M | $11.7k |
| 7 | +35 | USDf |
559.0 | $33.7M | $10.0k |
| 8 | -2 |  RLUSD RLUSD |
107.0 | $40.4M | $8.1k |
| 9 | +2 |  USD0 USD0 |
783.0 | $24.4M | $8.1k |
| 10 | +2 |  CRV CRV |
33.5k | $8.7M | $7.6k |
Top Chains by Fees
This week’s top chains are ranked by fees generated from swap pools. Hyperliquid is performing strongly, but the data clearly shows just how dominant Ethereum and Curve on Ethereum really is, nothing else even comes close.
| Position | Change | Chain | Swaps | Volume | Fees |
|---|---|---|---|---|---|
| 1 | - | Ethereum |
46.1k | $949.3M | $188.2k |
| 2 | - |  Hyperliquid Hyperliquid |
36.7k | $17.8M | $4.6k |
| 3 | +1 | Arbitrum |
26.0k | $24.0M | $2.8k |
| 4 | +2 |  Base Base |
20.3k | $8.6M | $2.6k |
| 5 | - | Fraxtal |
74.9k | $3.1M | $1.7k |
| 6 | +1 |  Optimism Optimism |
60.3k | $4.2M | $902 |
| 7 | -4 |  Polygon Polygon |
10.8k | $320.7k | $587 |
| 8 | +1 | Sonic |
19.4k | $8.4M | $382 |
| 9 | +1 |  Fantom Fantom |
1.2k | $109.4k | $303 |
| 10 | -2 |  Gnosis Gnosis |
17.2k | $4.8M | $274 |
Curve's ecosystem continues to expand rapidly, welcoming new teams and pools weekly. If you're interested in launching a pool, lending market, or simply want to connect with the community, join us on Telegram or Discord.
Risk Disclaimer
References to specific pools or Llamalend markets do not constitute endorsements of their safety. We strongly encourage conducting personal risk analysis before engaging with any pools or markets. Please review our detailed risk disclaimers: Pool Risk Disclaimer, Llamalend Risk Disclaimer, crvUSD Risk Disclaimer.