Curve Best Yields & Key Metrics | Week 23, 2025
Weekly yield and Curve ecosystem metric updates as of the 5th June, 2025

Market Overview
Risk appetite has declined across markets, leading to compressed yields and a slight 1.6% drop in Curve’s TVL, now at $2.34B. This decrease is primarily due to reduced crvUSD borrowing demand and a slight pullback in Llamalend TVL after ten consecutive weeks of growth.
Despite lower yields, Curve continues to offer some of the most attractive opportunities in DeFi. This weekly update highlights key metrics and standout yield opportunities across the ecosystem.
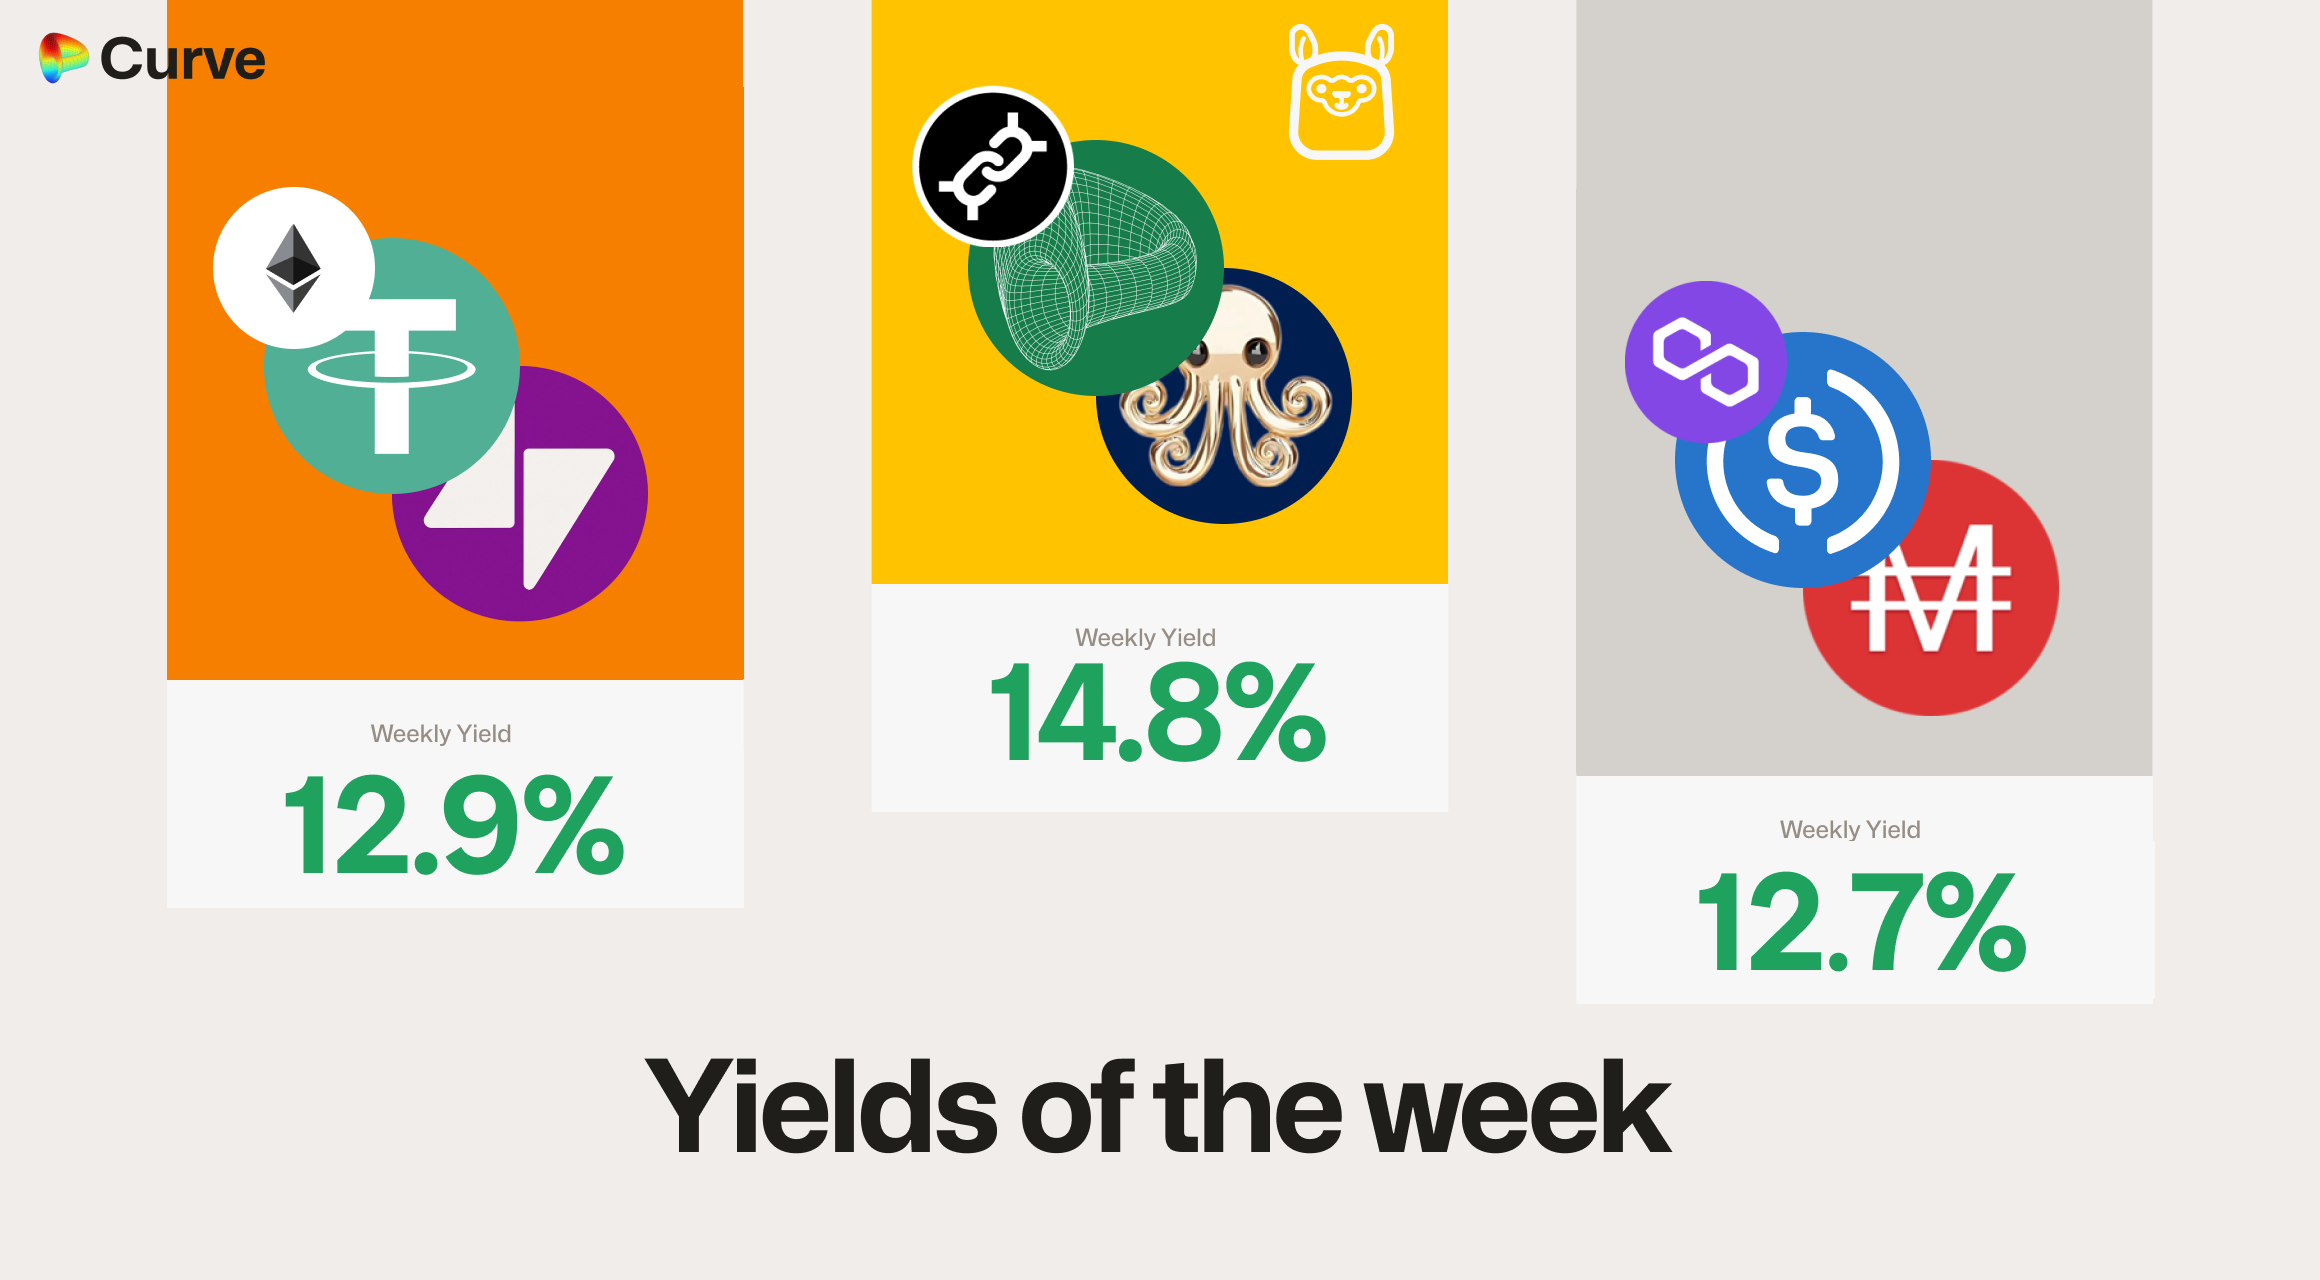
Top Yields
Top USD Stablecoin Yields
| Chain | Market | Type | Yield |
|---|---|---|---|
 |
 crvUSD crvUSD SQUID SQUID |
Llamalend | 14.8% |
 |
 USDT USDT tacUSD tacUSD |
Pool | 12.9% |
 |
 miMATIC miMATIC USDC.e USDC.e |
Pool | 12.7% |
|
 scrvUSD scrvUSD sfrxUSD sfrxUSD |
Pool | 12.3% |
|
crvUSD sfrxETH sfrxETH |
Llamalend | 12.3% |
 |
 axlUSDT axlUSDT USDt USDt |
Pool | 12.0% |
|
crvUSDsfrxUSD |
Llamalend | 11.4% |
 |
 crvUSD crvUSD scrvUSD scrvUSD |
Pool | 10.8% |
|
 USDC USDC RLUSD RLUSD |
Pool | 10.6% |
Top Major Asset Yields
| Chain | Pool | Asset | Yield |
|---|---|---|---|
|
 msETH msETH OETH OETH |
ETH | 7.3% |
|
 frxETHsfrxETH frxETHsfrxETH |
ETH | 6.6% |
 |
 uniETH uniETH WETH WETH |
ETH | 6.4% |
|
 EBTC EBTC tBTC tBTC |
BTC | 3.4% |
|
 WBTC WBTC tBTC tBTC |
BTC | 2.5% |
|
 tacBTC tacBTC cbBTC cbBTC FBTC FBTC |
BTC | 2.0% |
Other Asset Yields
| Chain | Pool | Asset | Yield |
|---|---|---|---|
|
 CRV CRV vsdCRV vsdCRV asdCRV asdCRV |
CRV | 20.9% |
|
 CRV CRV vsdCRV vsdCRV asdCRV asdCRV |
CRV | 18.5% | |
crvUSD WBTC WBTC WETH WETH |
TRICRYPTO | 13.3% |
|
 EURA EURA EURT EURT EURS EURS |
EUR | 3.9% |
Ecosystem Metrics
All changes (shown with + or -) represent the difference compared to values from one week ago.
CrvUSD & scrvUSD Performance
crvUSD supply increased this week, driven primarily by PegKeepers deploying part of their allocated reserves to push down the peg. Demand for crvUSD was strong, with the scrvUSD rate becoming especially attractive at 6.9%.
| Metric | Value | Change |
|---|---|---|
 crvUSD Total Supply crvUSD Total Supply |
$154M | +7.4% |
| crvUSD Borrowed |
$128M | -0.7% |
| Peg Stability Reserves |
$26.2M | +$11.5M |
 scrvUSD Yield scrvUSD Yield |
6.9% APY | +0.6% |
| crvUSD inscrvUSD |
37.9% | +9.2% |
| crvUSD Peg |
$1.0000 | - |
| Avg. Borrow Rate |
4.1% | -2.8% |
| Loans |
767 | -14 |
| Fees |
$167k | +0.3% |
Pool Statistics
Nearly all pool metrics are positive this week, showing how Curve shines in volatility.
| Metric | Value | Change |
|---|---|---|
| 🔄 TVL | $1.95B | +0.2% |
| 🔄 Volume | $1.96B | +20.5% |
| 🔄 Swaps | $356k | -1.1% |
| 🔄 Total Fees | $342k | +8.2% |
Llamalend Performance
TVL finally decreased slightly after being up only for the past 10 weeks, but borrowers continue to be attracted to the low rates and safety Llamalend has to offer.
| Metric | Value | Change |
|---|---|---|
| 🦙 Lending TVL | $179M | -2.8% |
| 🦙 Supplied | $154M | -1.6% |
| 🦙 Borrowed | $102M | +1.6% |
| 🦙 Loans | 942 | +32 |
Notable Pool Activity
Highest Volume Pools
The usual suspects continued to be the highest volume pools.
| Chain | Pool | Volume | TVL |
|---|---|---|---|
|
 DAIUSDCUSDT DAIUSDCUSDT |
$365M | $182M |
|
USDCUSDT |
$178M | $4.8M |
|
USDCRLUSD |
$131M | $54.2M |
|
 sUSDSUSDT sUSDSUSDT |
$99.5M | $50.6M |
Recently Launched Pools
There have been 14 new pools this week bringing in a total of over $12M TVL, the biggest 6 are highlighted below.


Highest Fee Generating Pools
| Chain | Pool | Fees | Volume |
|---|---|---|---|
|
DAIUSDCUSDT |
$29.2k | $365M |
|
USDT WBTC WBTC WETH WETH |
$21.3k | $13.4M |
|
WETH CVX CVX |
$13.3k | $3.4M |
|
USDCRLUSD |
$13.0k | $131M |
|
 USD0 USD0 USD0++ USD0++ |
$11.5k | $28.8M |
Curve's ecosystem continues to expand rapidly, welcoming new teams and pools weekly. If you're interested in launching a pool, lending market, or simply want to connect with the community, join us on Telegram or Discord.
Risk Disclaimer
References to specific pools or Llamalend markets do not constitute endorsements of their safety. We strongly encourage conducting personal risk analysis before engaging with any pools or markets. Please review our detailed risk disclaimers: Pool Risk Disclaimer, Llamalend Risk Disclaimer, crvUSD Risk Disclaimer.